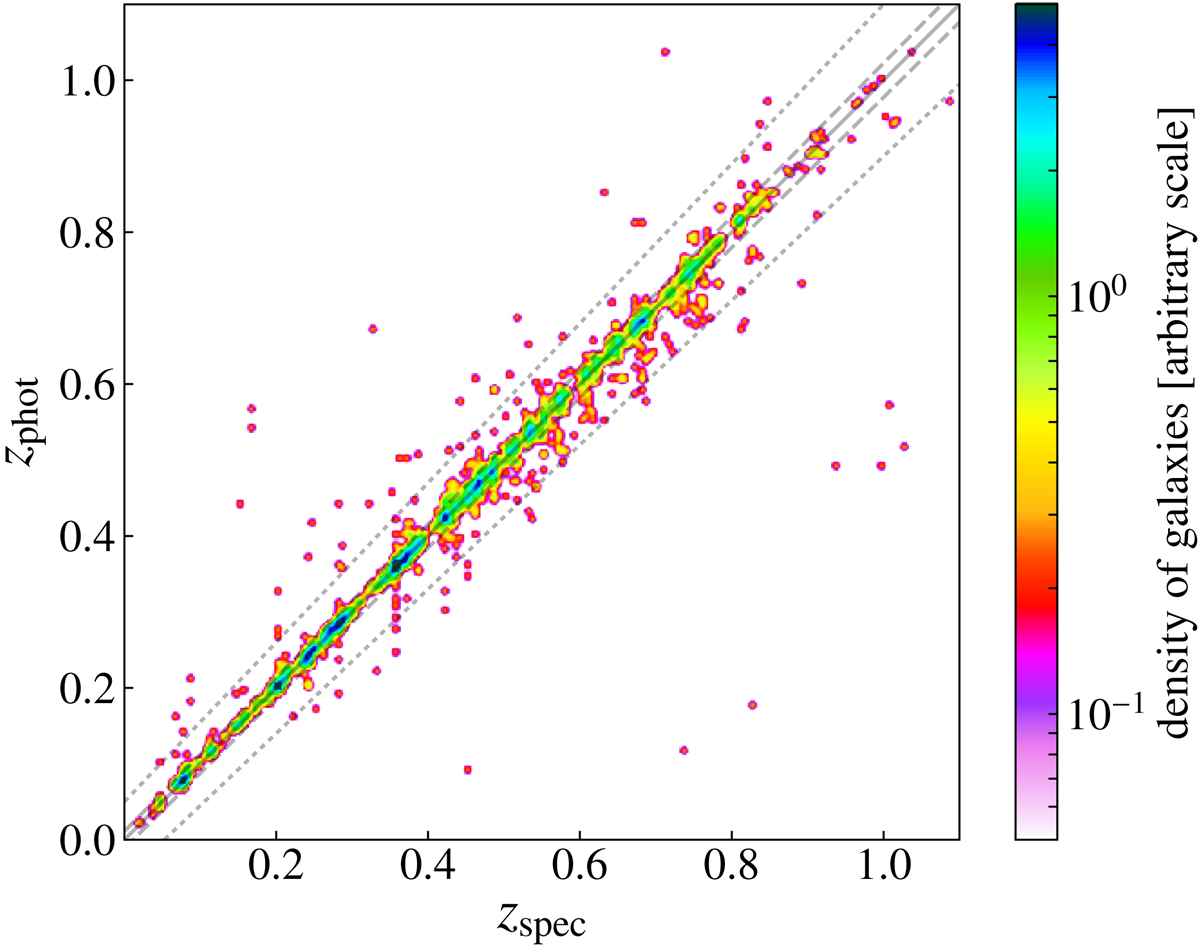
Fig. 9.
Download original image
Comparison between photometric and spectroscopic redshifts for miniJPAS galaxies at r < 22.5 with ODDS > 0.5. In order to better highlight the density of points, we have applied a 2D Gaussian smoothing to the data. The solid line marks the 1:1 relation. The two dashed lines enclose a region containing 80% of the sources, while the dotted lines indicate the |Δz| = 0.05 threshold used to define redshift outliers. We note that each outlier smoothed region corresponds to an individual source.
Current usage metrics show cumulative count of Article Views (full-text article views including HTML views, PDF and ePub downloads, according to the available data) and Abstracts Views on Vision4Press platform.
Data correspond to usage on the plateform after 2015. The current usage metrics is available 48-96 hours after online publication and is updated daily on week days.
Initial download of the metrics may take a while.