Fig. 1
Download original image
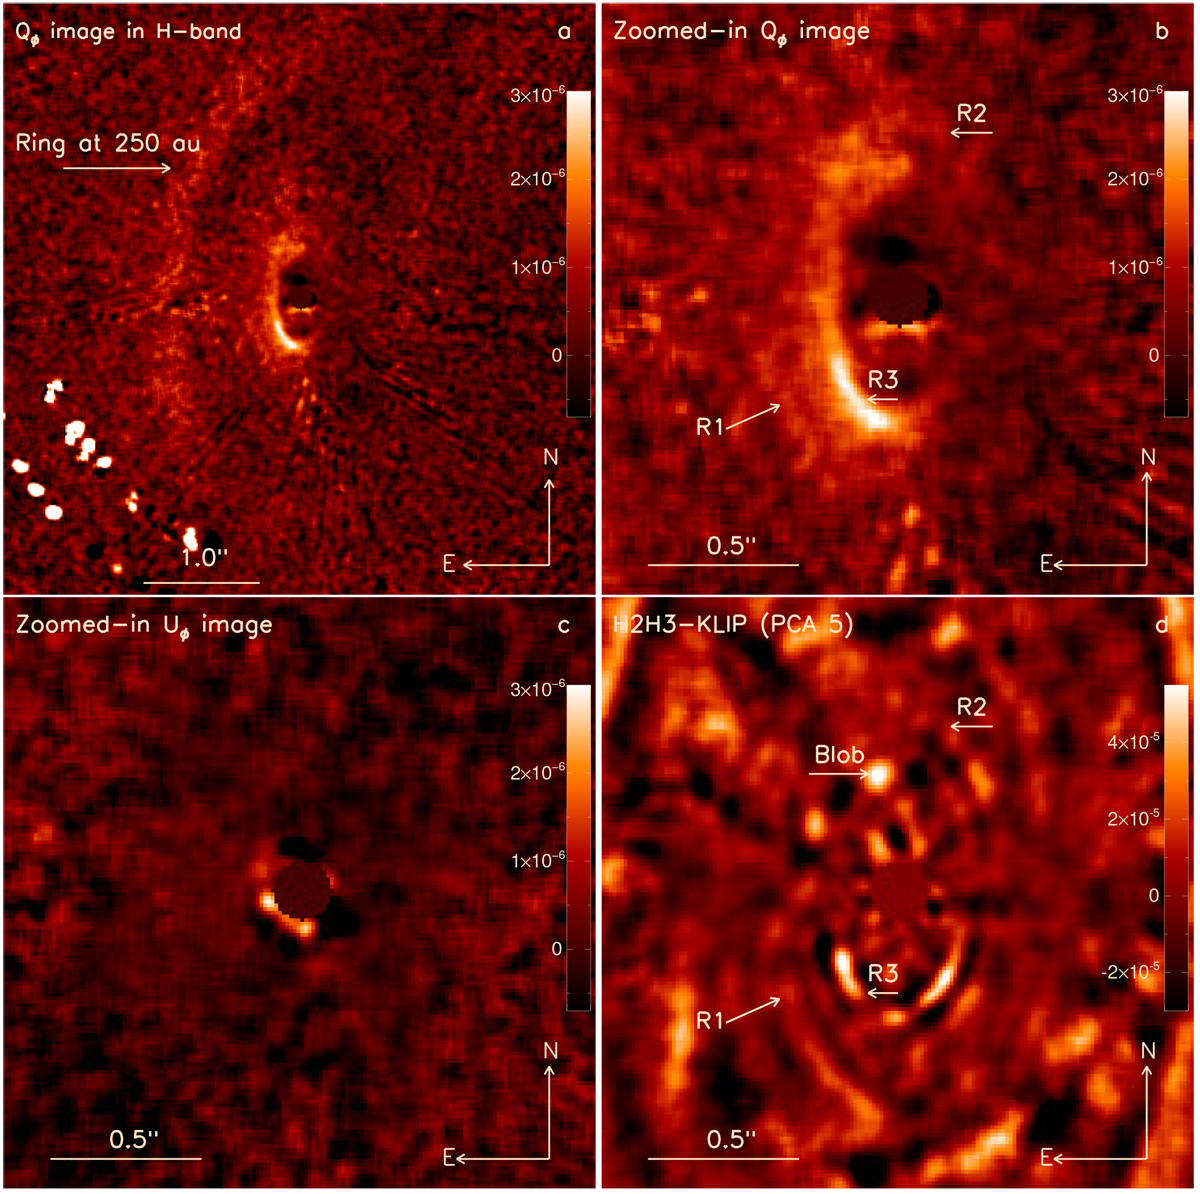
SPHERE observations of HD 141569A in polarized intensity (2017) and total intensity (2015) displayed in contrast units. Panels a, b, and c present the linear polarization intensity Qϕ and Uϕ images. Panel d shows the total intensity image in the same region as in (b). The image (a) presents the wide angle field of view (5″ × 5″) in polarimetry, while the images (b), (c) and (d) are at the same spatial scale and focused on the innermost region (2″ × 2″) of the system. All the labels and arrows in (b) and (d) are at the same position.
Current usage metrics show cumulative count of Article Views (full-text article views including HTML views, PDF and ePub downloads, according to the available data) and Abstracts Views on Vision4Press platform.
Data correspond to usage on the plateform after 2015. The current usage metrics is available 48-96 hours after online publication and is updated daily on week days.
Initial download of the metrics may take a while.