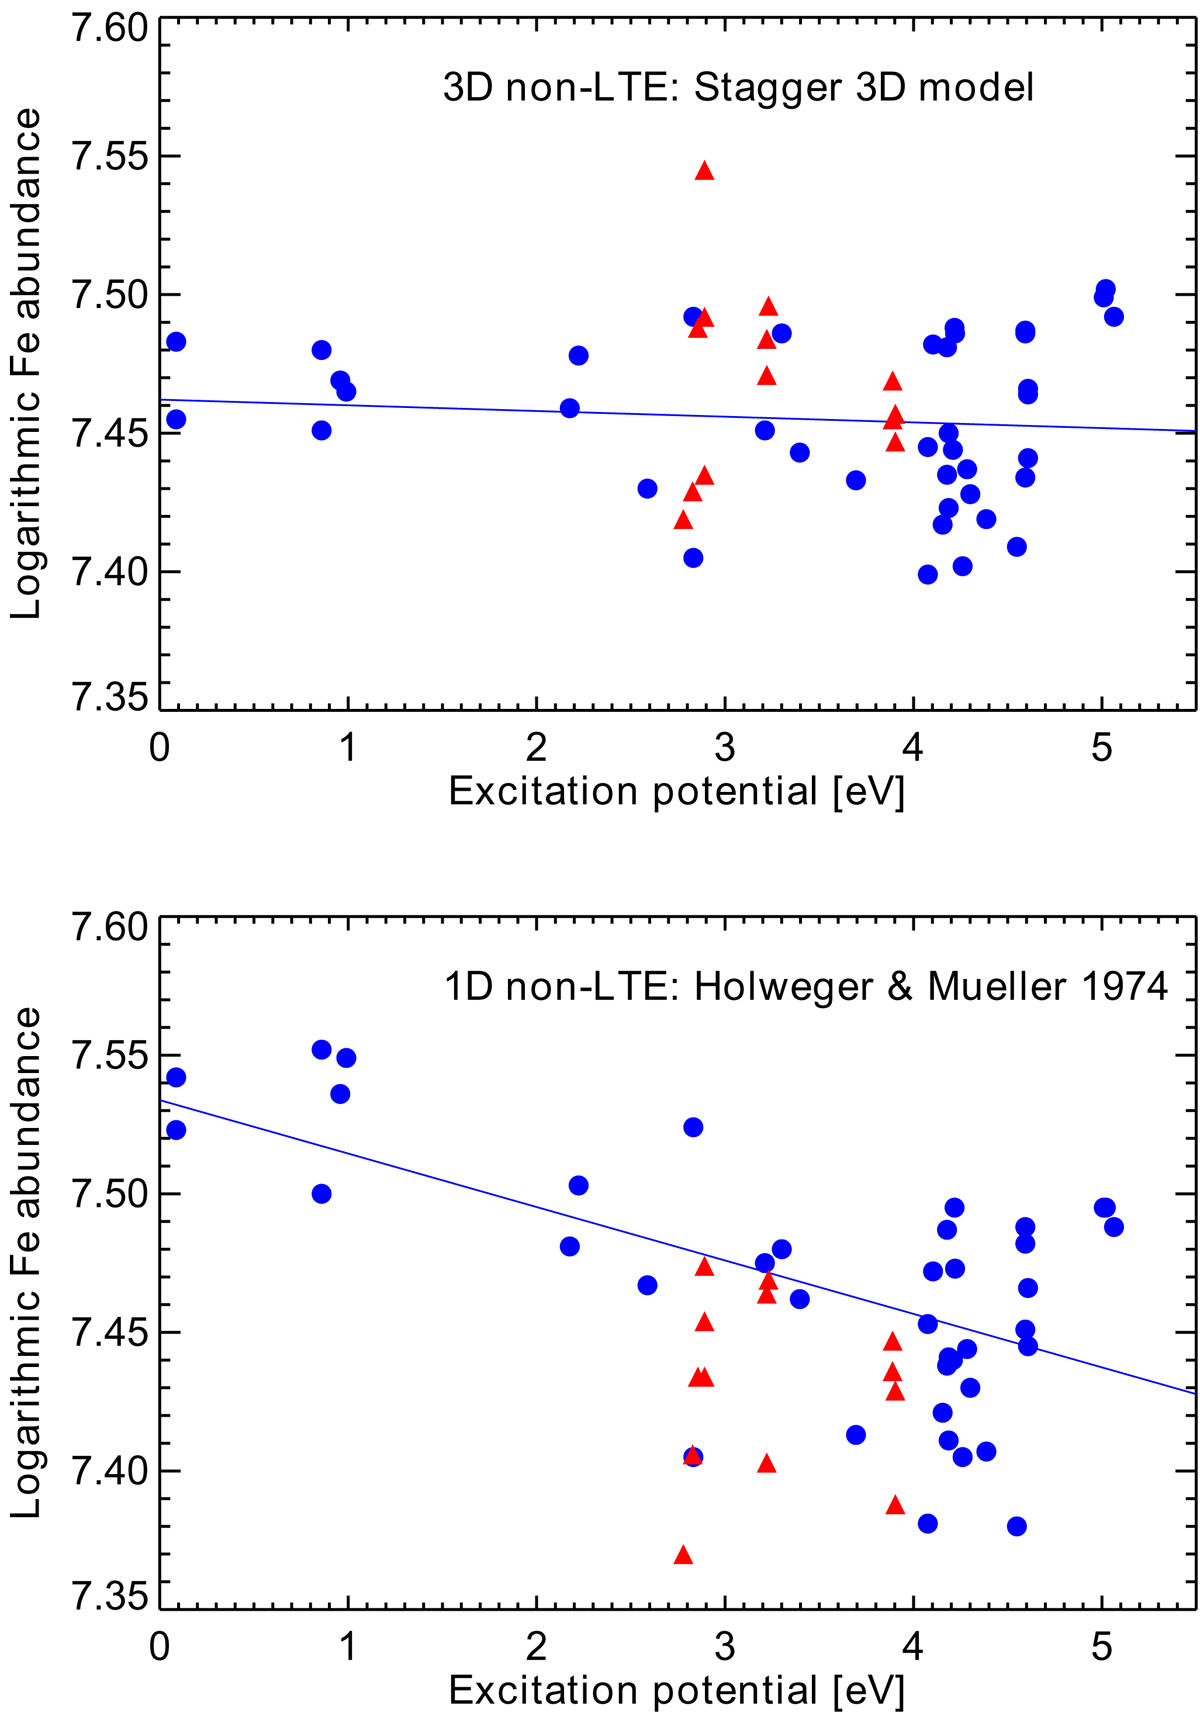
Fig. 2.
Download original image
Inferred photospheric Fe abundances from detailed non-LTE calculations using the 3D hydrodynamical Stagger model (upper panel) and the 1D Holweger & Müller (1974) model (lower panel). The results for Fe I and Fe II lines are shown as blue circles and red triangles, respectively. The solid lines denote the least-square fits to the Fe I results. In 3D non-LTE, there is excellent excitation and ionisation balance for Fe, contrary to the 1D case; it is noted that the trend with excitation potential with the Holweger & Müller (1974) model is even steeper in LTE (see Table A.2).
Current usage metrics show cumulative count of Article Views (full-text article views including HTML views, PDF and ePub downloads, according to the available data) and Abstracts Views on Vision4Press platform.
Data correspond to usage on the plateform after 2015. The current usage metrics is available 48-96 hours after online publication and is updated daily on week days.
Initial download of the metrics may take a while.