Open Access
Fig. 4
Download original image
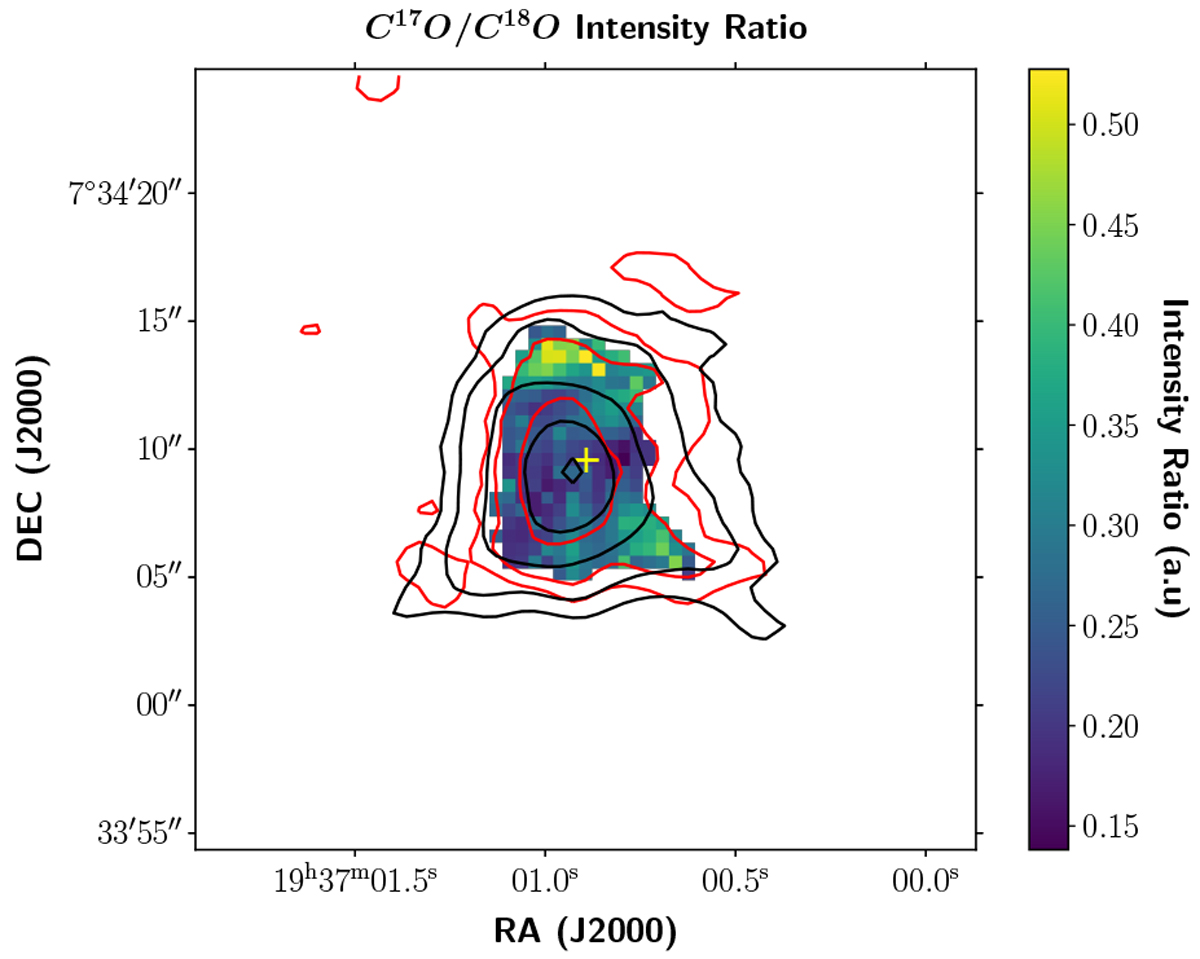
C17O to C18O integrated intensity ratio. Red contours show integrated intensity for C17O at −3, 3, 5, 10 and 30σ, where σ is 10.0 mJy beam−1. Black contours show integrated intensity for C18O at −3, 3, 5, 10 and 30σ, where σ is 10.7 mJy beam−1. The yellow cross indicates the centroid position of B335.
Current usage metrics show cumulative count of Article Views (full-text article views including HTML views, PDF and ePub downloads, according to the available data) and Abstracts Views on Vision4Press platform.
Data correspond to usage on the plateform after 2015. The current usage metrics is available 48-96 hours after online publication and is updated daily on week days.
Initial download of the metrics may take a while.