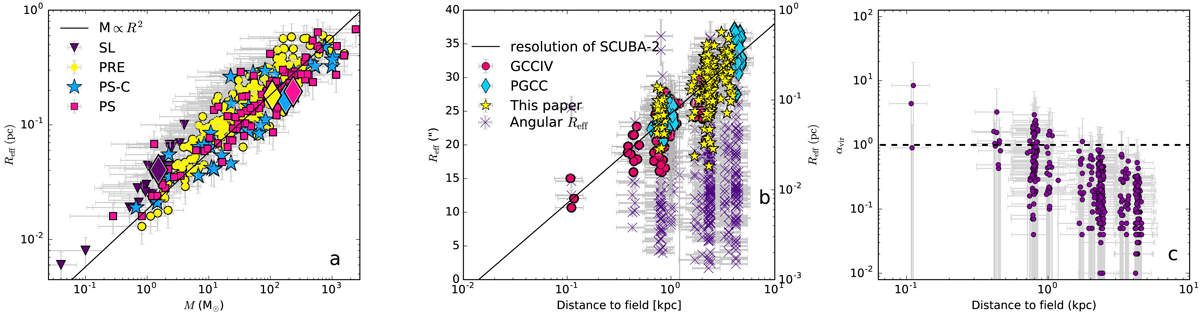
Fig. 12.
Download original image
(a) Effective clump radius as a function of clump mass. The symbols correspond to unconfirmed PS (pink squares), PS-C (blue stars), PRE (yellow circles), and unbound SL (purple triangles) clumps. Mean mass and radius are plotted with diamonds of the same color. The black line shows M ∝ R2. (b) Angular size (left axis, purple crosses) and spatial size (right axis) of the clumps as a function of distance on a logarithmic scale. The distances are from GCCIV (Montillaud et al. 2015) (pink circles), the PGCC catalog (Planck Collaboration XXVIII 2016) (blue diamonds), and this paper (yellow stars). Random jitter of ≤10% has been added to distances to improve readability. The black line corresponds to the resolution of the SCUBA-2 instrument. (c) Clump αvir (blue circles) plotted as a function of distance. Random jitter of ±3% of distance has been added for readability. The black dashed line is the limit of gravitational instability.
Current usage metrics show cumulative count of Article Views (full-text article views including HTML views, PDF and ePub downloads, according to the available data) and Abstracts Views on Vision4Press platform.
Data correspond to usage on the plateform after 2015. The current usage metrics is available 48-96 hours after online publication and is updated daily on week days.
Initial download of the metrics may take a while.