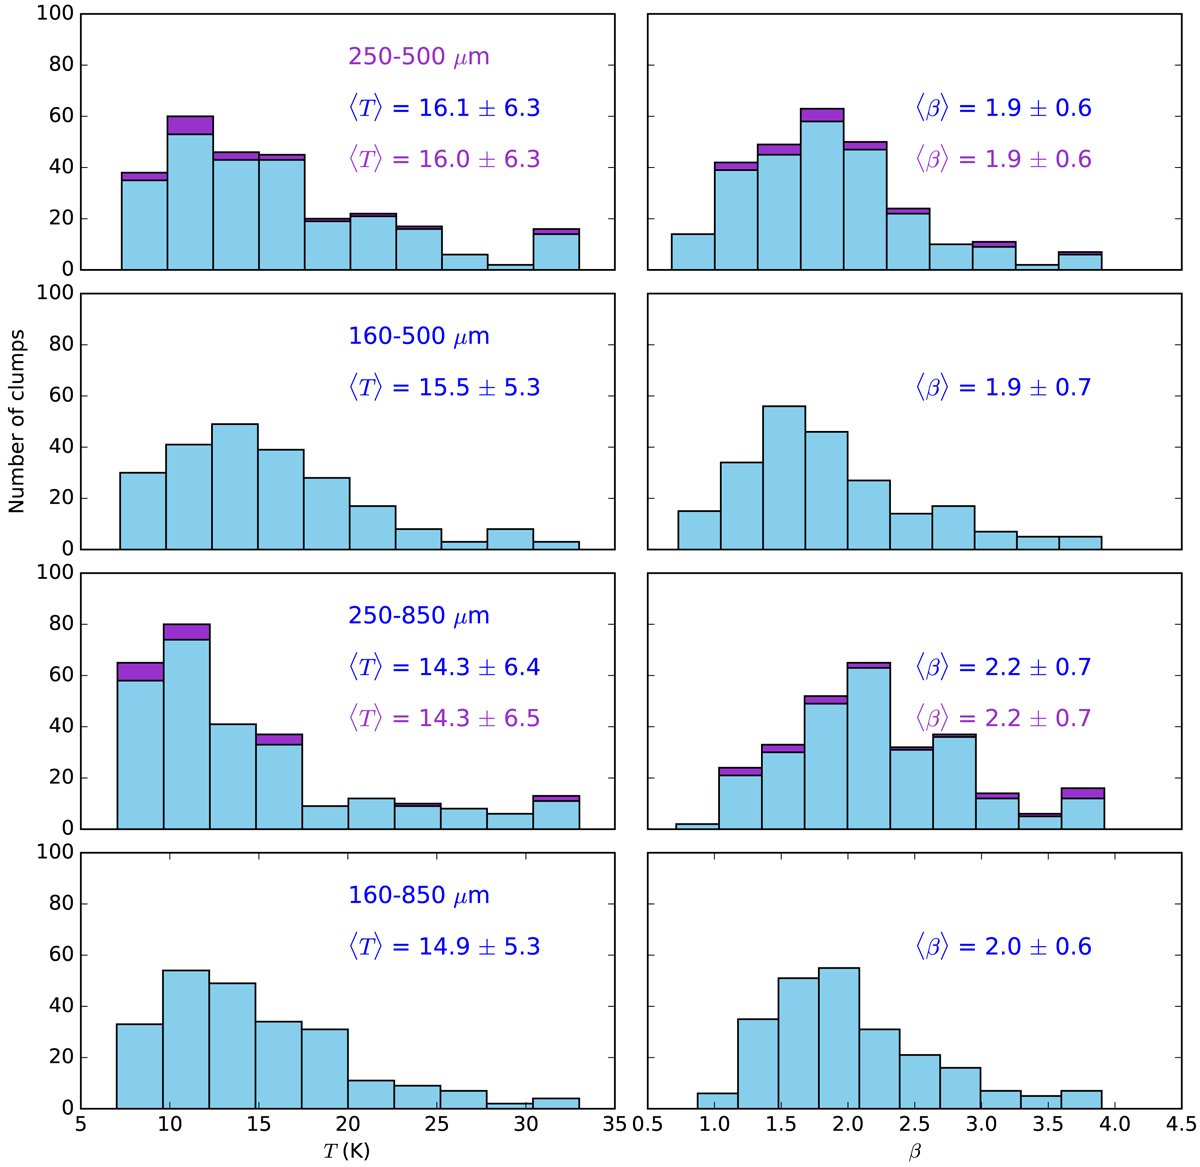
Fig. B.1.
Download original image
Comparison of MBB fits of clump spectra performed using different band combinations. The purple histograms correspond to all the clumps and the blue histograms to the subsets of clumps for which 160 μm measurements also exist. The mean values and standard deviations of the temperature and the dust opacity spectral index distributions are given in the frames, written with the same colors.
Current usage metrics show cumulative count of Article Views (full-text article views including HTML views, PDF and ePub downloads, according to the available data) and Abstracts Views on Vision4Press platform.
Data correspond to usage on the plateform after 2015. The current usage metrics is available 48-96 hours after online publication and is updated daily on week days.
Initial download of the metrics may take a while.