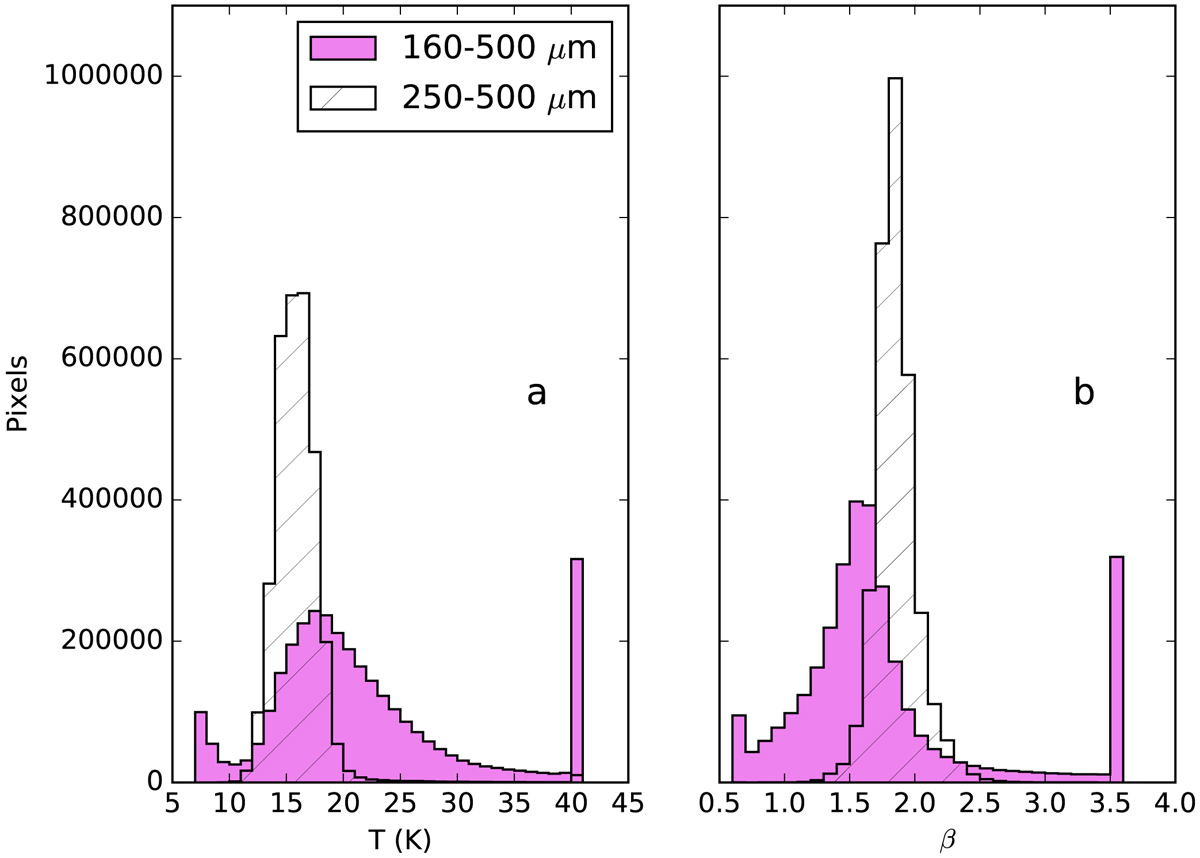
Fig. 3.
Download original image
Temperature (a) and spectral index (b) histograms for the entire fields, computed with SED fits of the 250–500 μm (hatched histogram) and 160–500 μm (purple histograms) data. Only areas covered by both PACS and SPIRE observations are used. As the MBB script fits temperatures between 5–40 K, and spectral index between 0.6 and 3.5, thus the first and last bins include all pixels with T or β outside of these ranges.
Current usage metrics show cumulative count of Article Views (full-text article views including HTML views, PDF and ePub downloads, according to the available data) and Abstracts Views on Vision4Press platform.
Data correspond to usage on the plateform after 2015. The current usage metrics is available 48-96 hours after online publication and is updated daily on week days.
Initial download of the metrics may take a while.