Fig. J.1.
Download original image
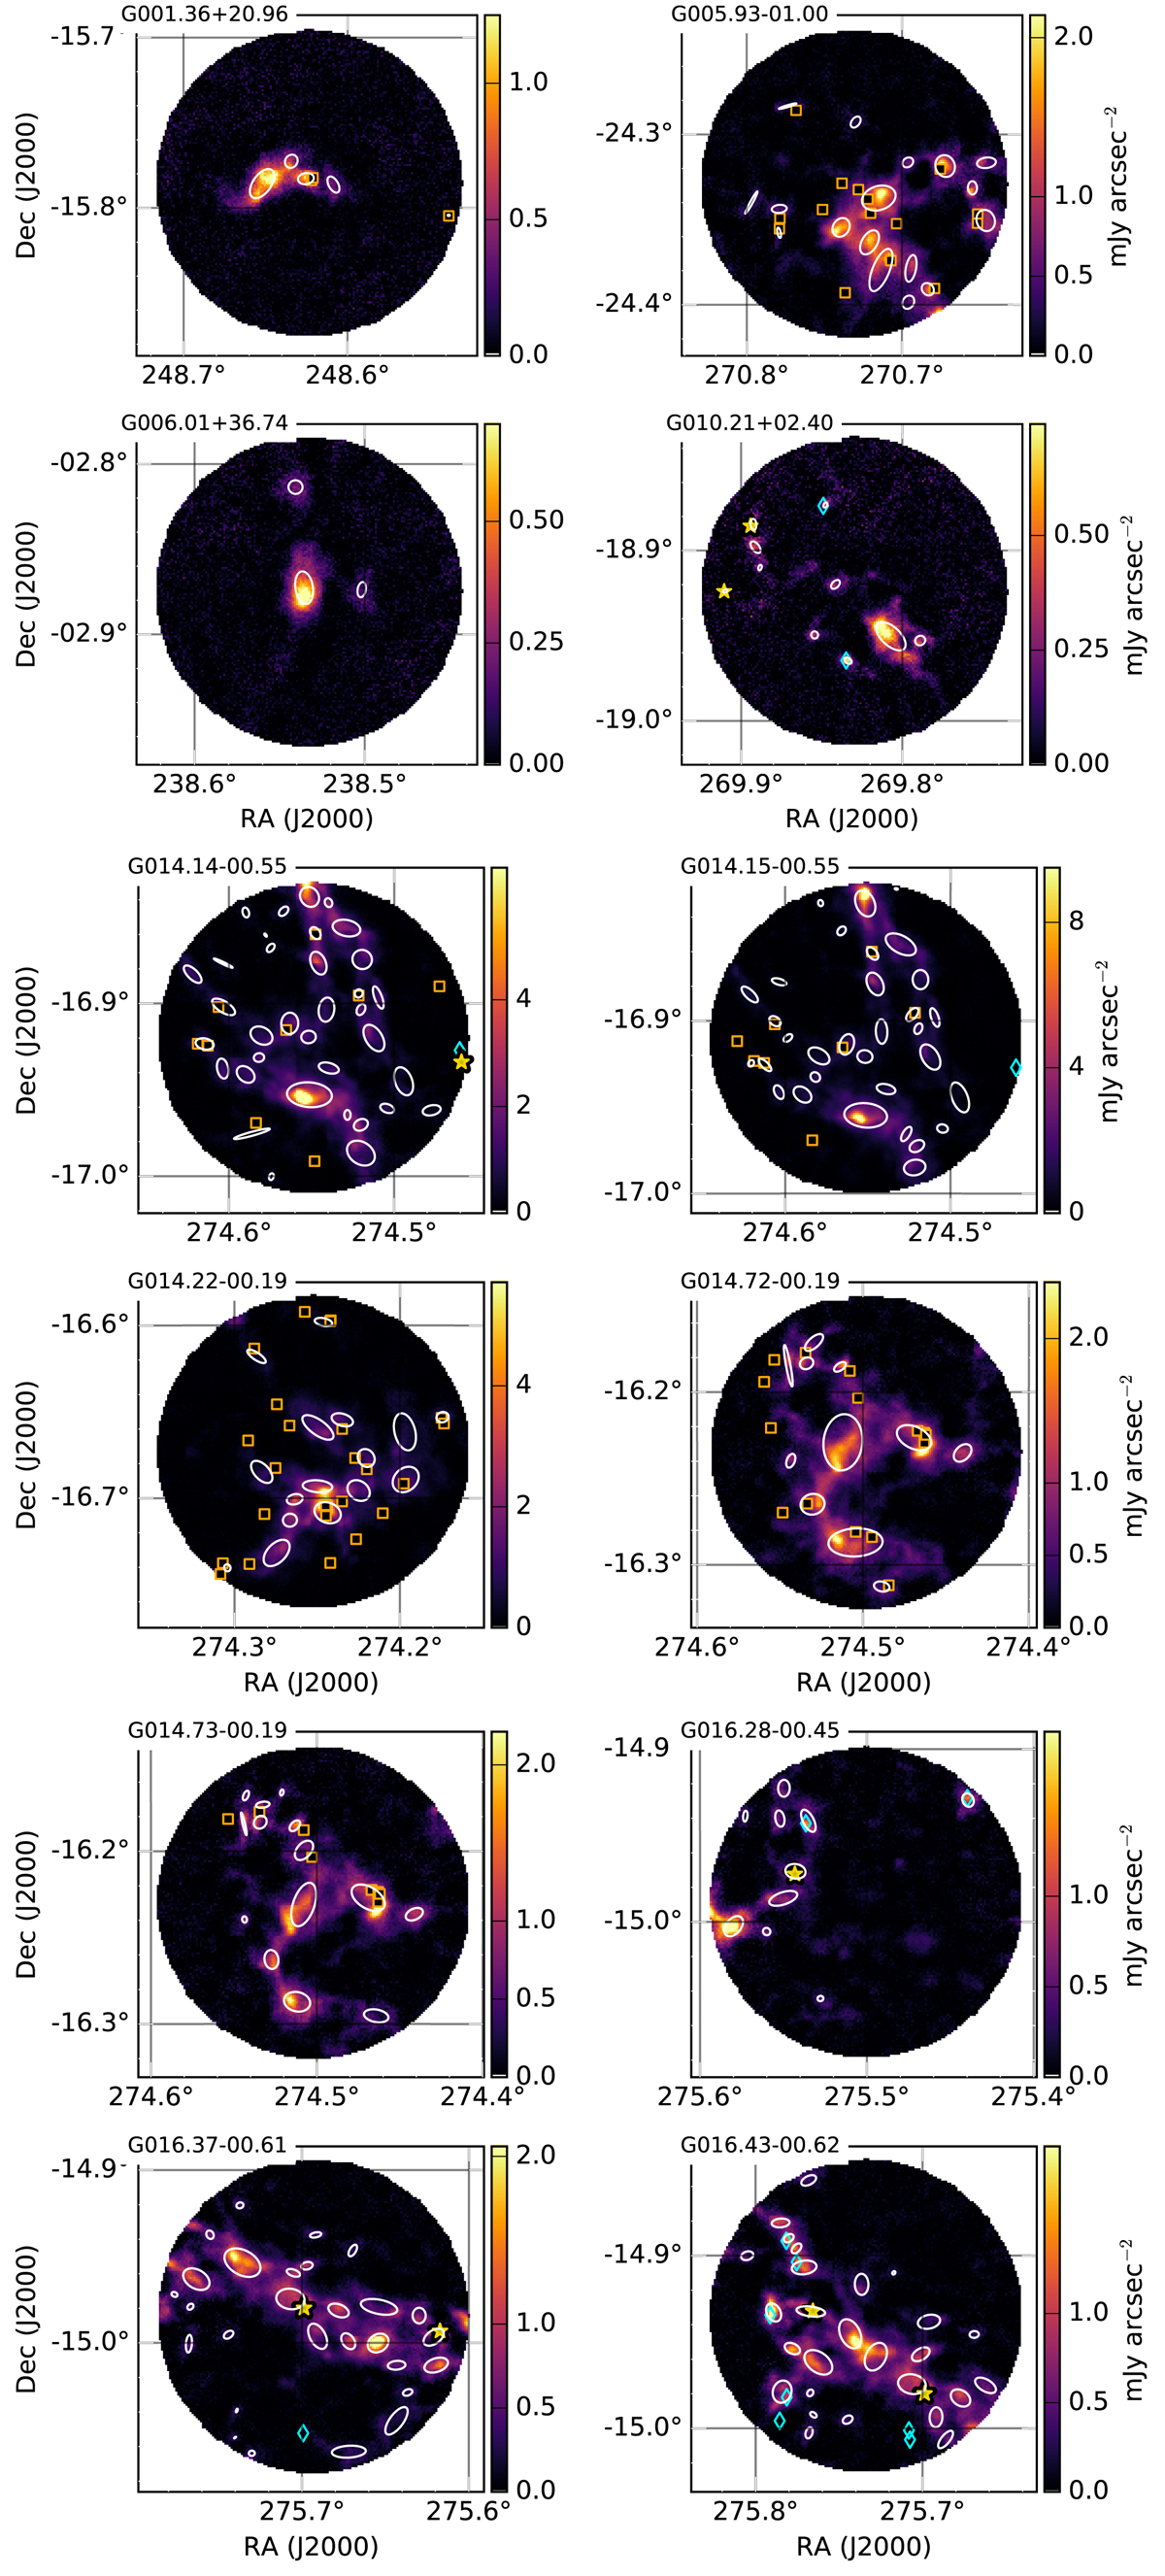
Surface brightness maps of the SCUBA-2 850 μm intensity. Clumps found by FellWalker are plotted with white ellipses. The orange squares with black centers show the locations of unconfirmed YSOs for which Herschel intensity ratio was not possible to calculate. The cyan diamonds show those YSOs that do not show significant increase in ΔC, and yellow stars those YSOs that have been confirmed with ΔC. Field YSOs are not plotted and no distinction is made between YSOs from different catalogs. The field names are in the top left.
Current usage metrics show cumulative count of Article Views (full-text article views including HTML views, PDF and ePub downloads, according to the available data) and Abstracts Views on Vision4Press platform.
Data correspond to usage on the plateform after 2015. The current usage metrics is available 48-96 hours after online publication and is updated daily on week days.
Initial download of the metrics may take a while.