Fig. 2.
Download original image
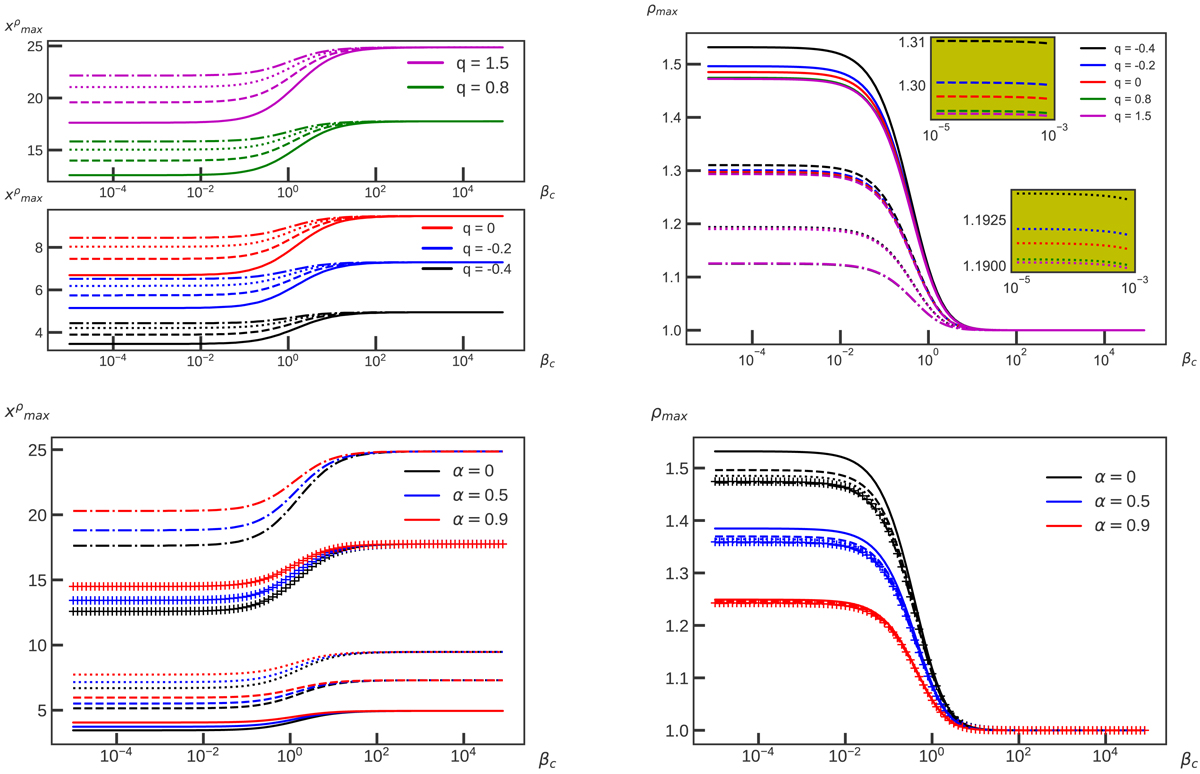
Variation of the location (left panels) and amplitude (right panels) of the rest-mass density maximum over βc for different angular momentum profiles and q. Top panels: power-law distribution. The thick line shows the constant case, the dashed line presents model 3, the dotted line model 2, and the dot-dashed line model 1 in Fig. 1. Bottom panels: trigonometric profiles of angular momentum in different colours. The dotted line represents q = 0, the solid line q = −0.4, the dashed line q = −0.2, the crossed line q = 0.8, and the dot-dashed line q = 1.5.
Current usage metrics show cumulative count of Article Views (full-text article views including HTML views, PDF and ePub downloads, according to the available data) and Abstracts Views on Vision4Press platform.
Data correspond to usage on the plateform after 2015. The current usage metrics is available 48-96 hours after online publication and is updated daily on week days.
Initial download of the metrics may take a while.