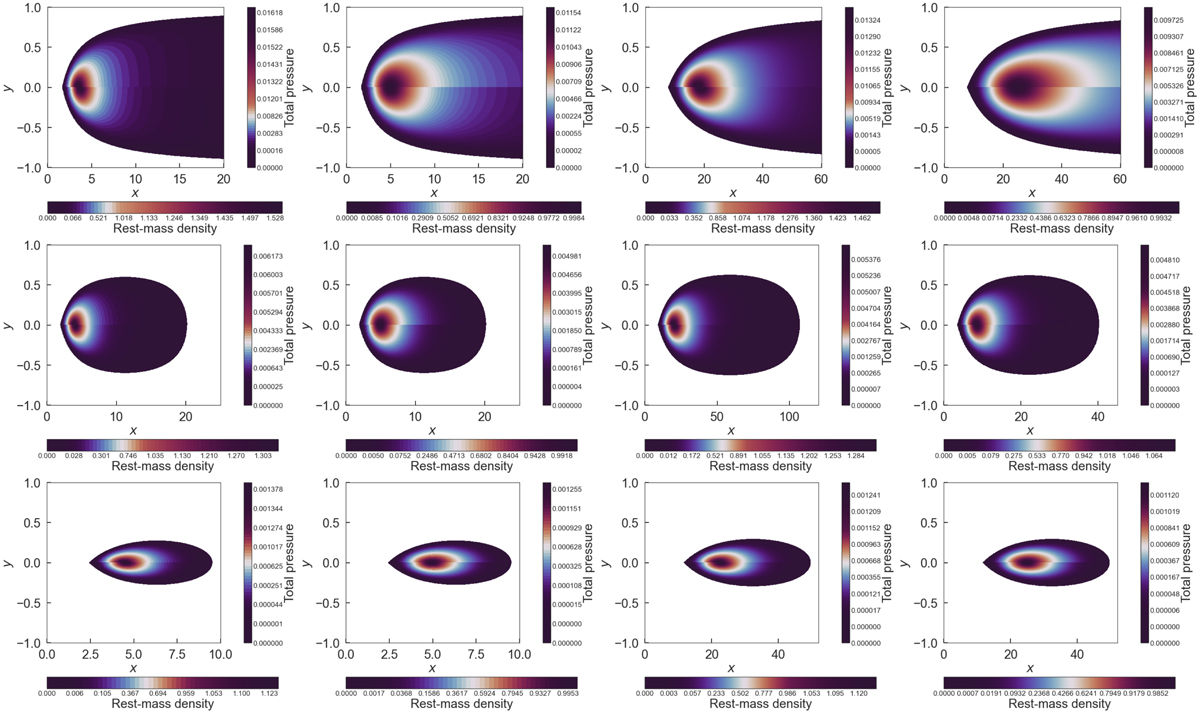
Fig. 3.
Download original image
Map of the rest-mass density (top half of each panel) and map of the total pressure (bottom half of each panel) for the power-law distribution. In the first two columnsq = −0.4. In the last two columnsq = 1.5. Columns 1 and 3 present βc = 10−3, and Cols. 2 and 4 show βc = 103. In addition, each row depicts a different distribution of angular momentum: the constant case, model 3, and model 1 (from top to bottom).
Current usage metrics show cumulative count of Article Views (full-text article views including HTML views, PDF and ePub downloads, according to the available data) and Abstracts Views on Vision4Press platform.
Data correspond to usage on the plateform after 2015. The current usage metrics is available 48-96 hours after online publication and is updated daily on week days.
Initial download of the metrics may take a while.