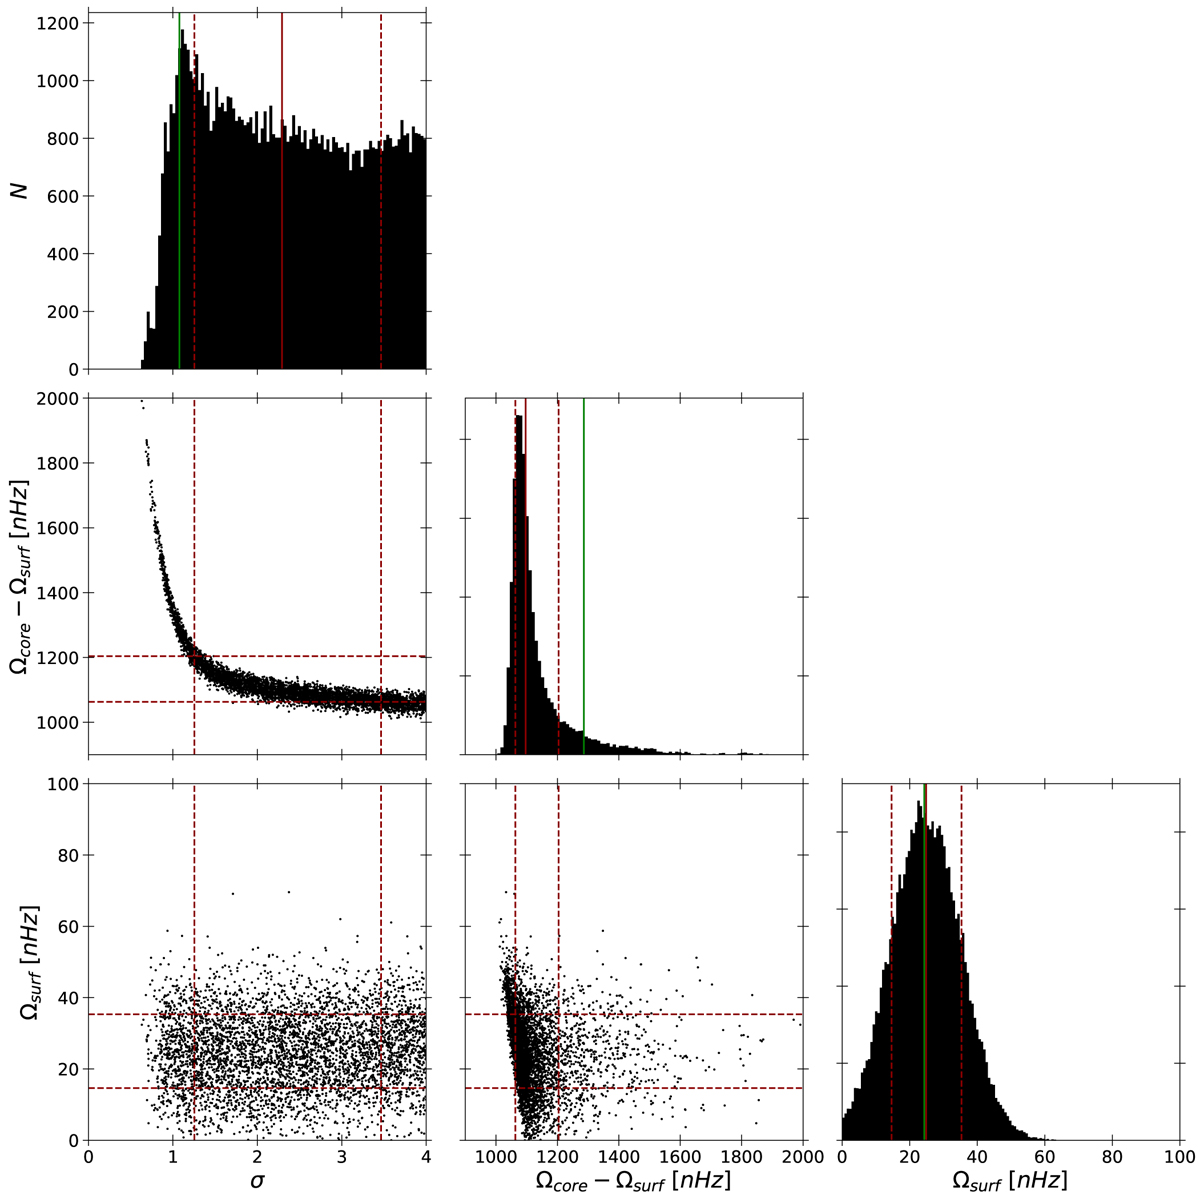
Fig. 7.
Download original image
Triangle diagram presenting the posterior distribution from the MCMC analysis on the Gaussian function with the data of Kepler-56. The red solid line represents the median, the red dotted lines it’s one-sigma uncertainties and the green solid line the maximum of the likelihood solution. Only a small fraction of the sampler is displayed to avoid overweighted figures, however, the histograms were constructed with the full sample.
Current usage metrics show cumulative count of Article Views (full-text article views including HTML views, PDF and ePub downloads, according to the available data) and Abstracts Views on Vision4Press platform.
Data correspond to usage on the plateform after 2015. The current usage metrics is available 48-96 hours after online publication and is updated daily on week days.
Initial download of the metrics may take a while.