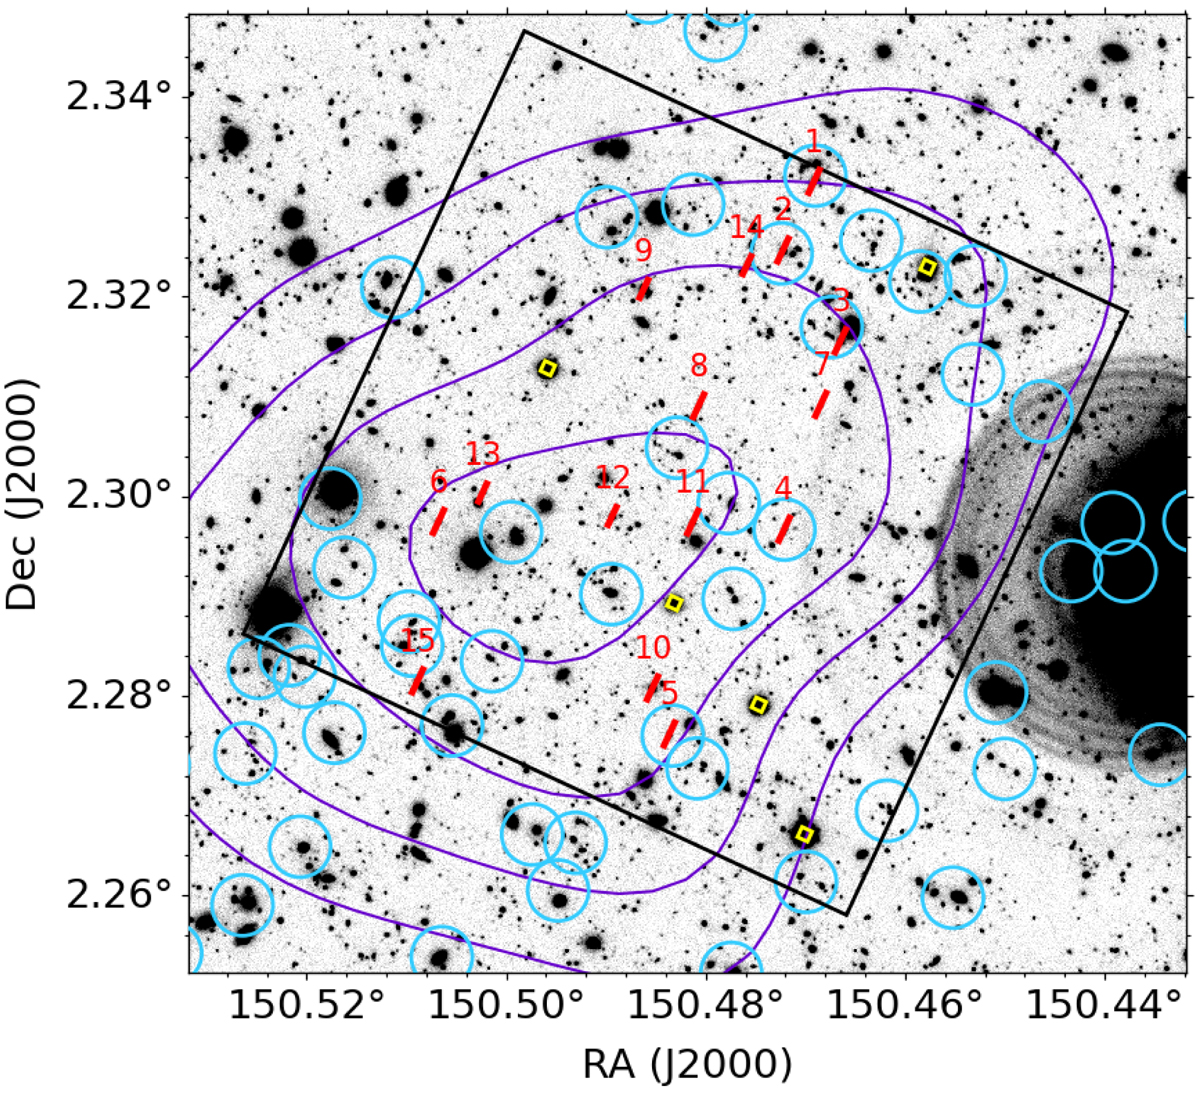
Fig. 1.
Download original image
Layout of the LUCI mask (black square: 4′ × 4′) overlaid on the UltraVISTA Ks-band 6′ × 6′ image. The slits assigned to the spectroscopic targets are shown as red rectangles (1″ × 8–10″) and identified by the slit number, alignment stars are shown by yellow square. The SPIRE sources positions are indicated by blue circles (11″ in radius). Planck red-excess contours (at 50, 62.5, 75 and 87.5% of the highest value) are shown as purple lines. North is up and east to the left.
Current usage metrics show cumulative count of Article Views (full-text article views including HTML views, PDF and ePub downloads, according to the available data) and Abstracts Views on Vision4Press platform.
Data correspond to usage on the plateform after 2015. The current usage metrics is available 48-96 hours after online publication and is updated daily on week days.
Initial download of the metrics may take a while.