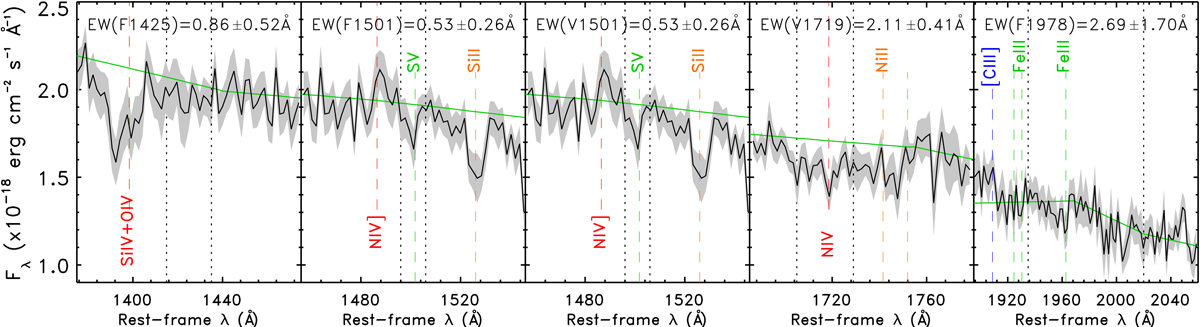
Fig. 12.
Download original image
Stacked spectrum (black solid line) and 1σ uncertainty (gray filled area) and pseudo-continuum (green solid line) used to compute the indices listed in Table 4. The wavelength interval used to compute the EW is delimited by two black vertical dotted lines. The name and location of the main spectral features are indicated by dashed lines as in Fig. 11. The final EWs, computed as the median and 1σ uncertainty measured after perturbing the spectrum 1000 times, are annotated on top of each panel.
Current usage metrics show cumulative count of Article Views (full-text article views including HTML views, PDF and ePub downloads, according to the available data) and Abstracts Views on Vision4Press platform.
Data correspond to usage on the plateform after 2015. The current usage metrics is available 48-96 hours after online publication and is updated daily on week days.
Initial download of the metrics may take a while.