Fig. 17.
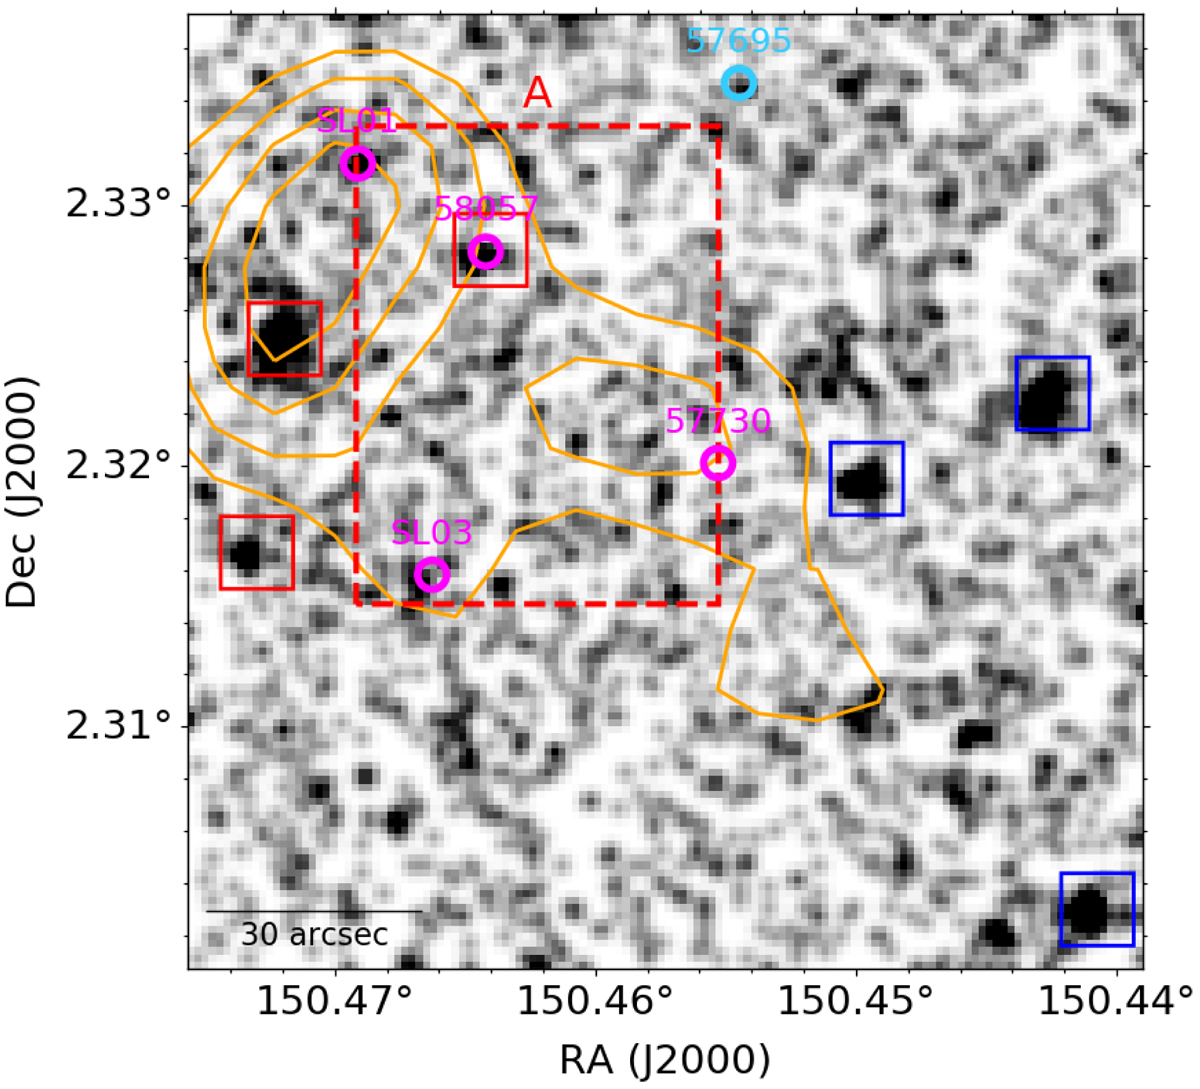
Download original image
Chandra 0.5–7 KeV rebinned 2.2′ × 2.2′ image of the protocluster core. Spectroscopic members are shown with 3″ radius circles (magenta if 2.15 ≤ z < 2.164, light blue if 2.19 < z < 2.20), and X-ray detected sources with 10″ × 10″ boxes (red if detected by both Chandra and XMM-Newton, and blue if detected only by Chandra). There are several X-ray sources missing in the released Chandra Cosmos catalog, including IDs SL01, and probably SL03, and 57695. SPIRE 350 μm contours are shown in orange. The red rectangle shows the boundaries of the protocluster core (component A in Sect. 3.4).
Current usage metrics show cumulative count of Article Views (full-text article views including HTML views, PDF and ePub downloads, according to the available data) and Abstracts Views on Vision4Press platform.
Data correspond to usage on the plateform after 2015. The current usage metrics is available 48-96 hours after online publication and is updated daily on week days.
Initial download of the metrics may take a while.