Fig. 19.
Download original image
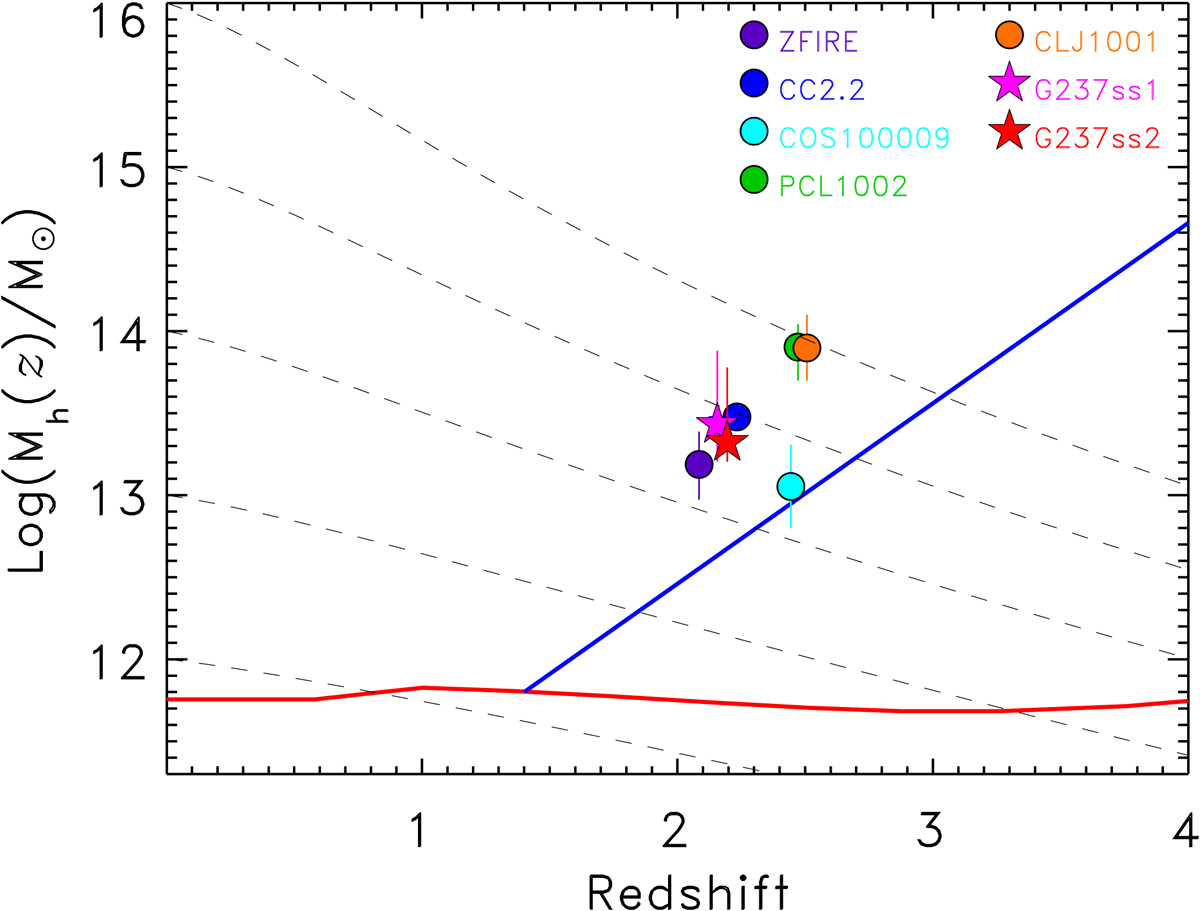
Protocluster dark matter halo mass as a function of redshift for the protoclusters in the Cosmos field at z ≃ 2 listed in Table 9 as annotated, and for the G237 substructures (ss1: magenta full star, ss2: red full star). The dashed black lines represent the average halo mass growth based on the fitting functions formulated by Behroozi et al. (2013). Thick lines indicate different gas cooling regimes as predicted by Dekel & Birnboim (2006): below a critical halo mass of ![]() (red curve) inflowing gas is predominantly cold allowing galaxies to grow (in addition to merging); above
(red curve) inflowing gas is predominantly cold allowing galaxies to grow (in addition to merging); above ![]() (red curve), and below a critical redshift, zcrit (to the left of the blue line), cold gas flows are shock-heated, thus shutting off most of the gas supply to the galaxies; above
(red curve), and below a critical redshift, zcrit (to the left of the blue line), cold gas flows are shock-heated, thus shutting off most of the gas supply to the galaxies; above ![]() (red curve), and above zcrit (to the right of the blue line) cold gas is able to penetrate the hot gas environment through cold flow streams favoring galaxy growth and star formation.
(red curve), and above zcrit (to the right of the blue line) cold gas is able to penetrate the hot gas environment through cold flow streams favoring galaxy growth and star formation.
Current usage metrics show cumulative count of Article Views (full-text article views including HTML views, PDF and ePub downloads, according to the available data) and Abstracts Views on Vision4Press platform.
Data correspond to usage on the plateform after 2015. The current usage metrics is available 48-96 hours after online publication and is updated daily on week days.
Initial download of the metrics may take a while.