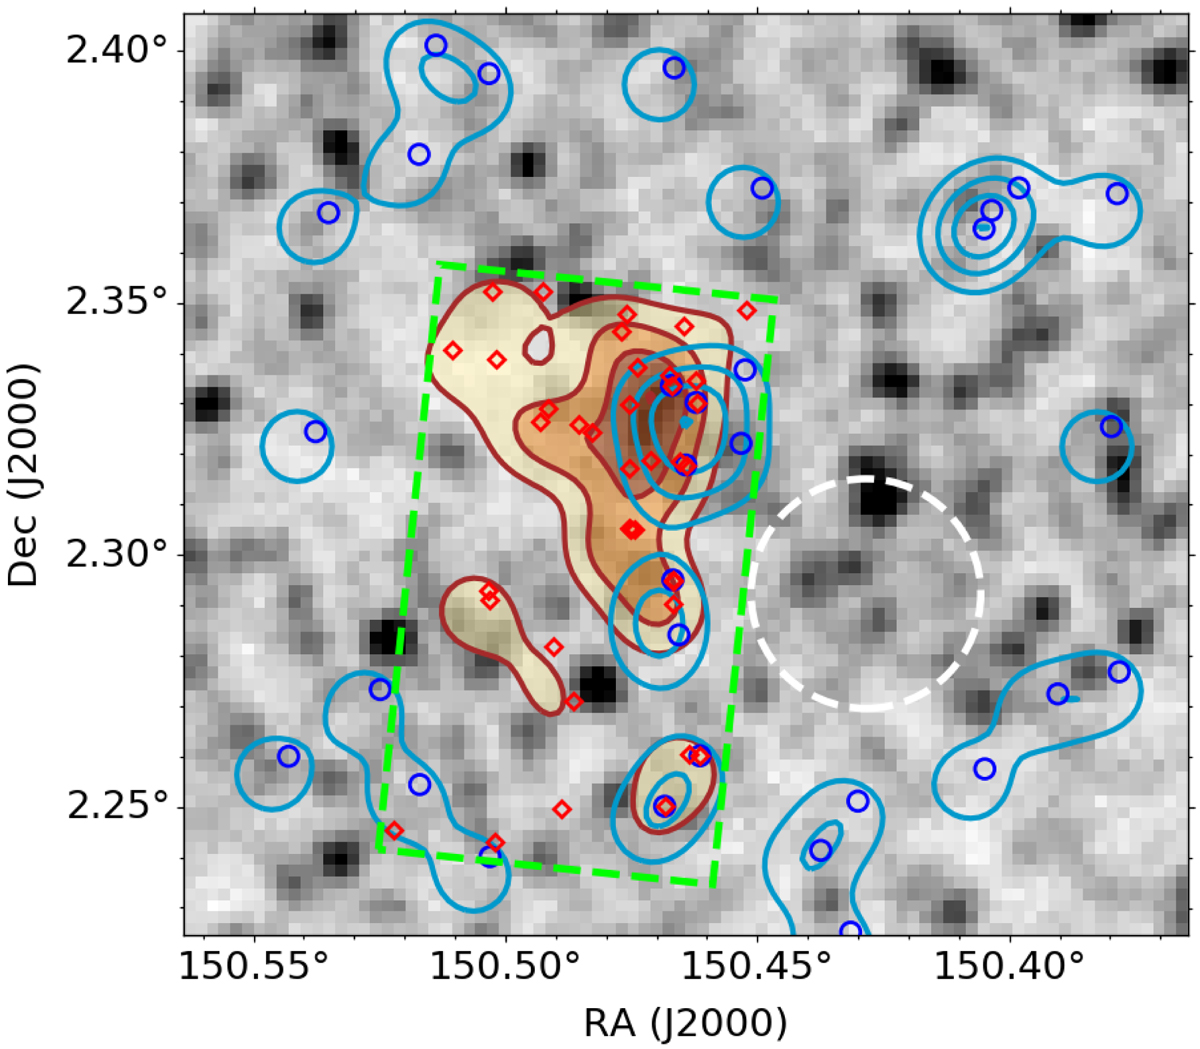
Fig. 3.
Download original image
Spatial distribution of spectroscopic sources (blue circles), and HAEs (red diamonds) overplotted on the SPIRE 350 μm image of the G237 field. The yellow-brown filled contours show the HAE projected density, and the turquoise contours the projected density of the spectroscopic sources. The density contour levels are shown at 25, 50, 75, and 100% of the maximum value. The dashed green rectangle represents the MOIRCS field of view where the HAE were selected (Koyama et al. 2021). The spectroscopic and HAE density peaks are 38″ apart. The white circle represents a masked region in the L16 catalog due to the presence of a bright star.
Current usage metrics show cumulative count of Article Views (full-text article views including HTML views, PDF and ePub downloads, according to the available data) and Abstracts Views on Vision4Press platform.
Data correspond to usage on the plateform after 2015. The current usage metrics is available 48-96 hours after online publication and is updated daily on week days.
Initial download of the metrics may take a while.