Fig. 3.
Download original image
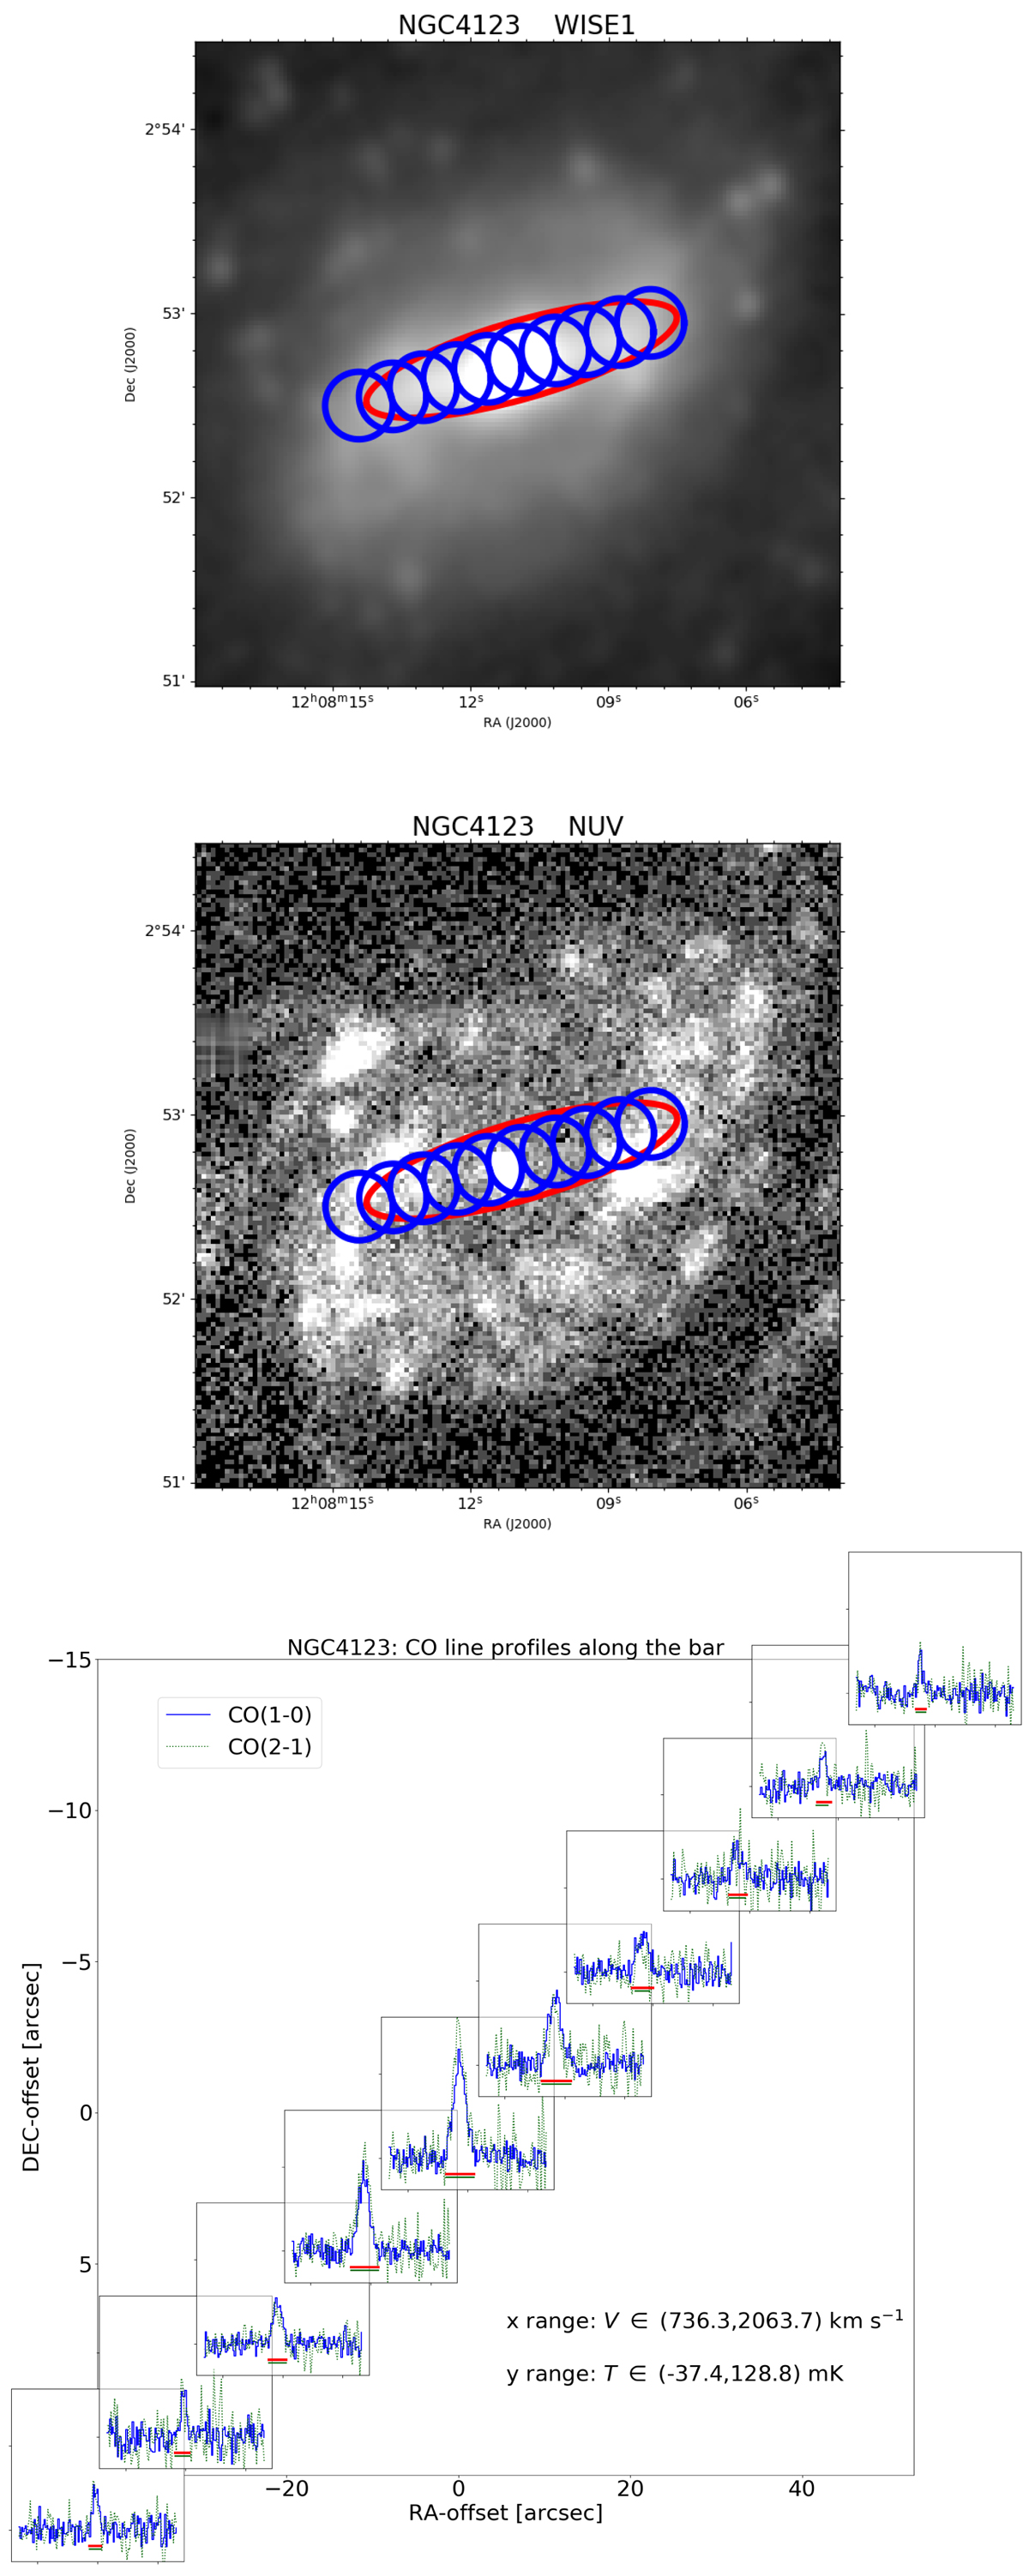
WISE 1 (top panel) and GALEX far-UV (middle panel) images of NGC 4123. The bar isophote, based on ellipse fitting of 3.6 μm images from Herrera-Endoqui et al. (2015) and Díaz-García et al. (2016b), is highlighted with a red ellipse. We show the circular beams where aperture photometry was performed (IRAM-30 m 22″ pointings) in blue, spaced by 11″ and covering the whole bar. Bottom panel: CO emission-line spectra along the bar of NGC 4123. The blue and green lines show the CO(1–0) and CO(2–1) spectra, respectively. The spectra are located on the plot in such a way that their centre corresponds to the offset of the pointing, relative to the central one. The red and green horizontal segments respectively show the zero-level line width of the CO(1–0) and CO(2–1) lines adopted for the determination of the velocity integrated intensities. The velocity (optical convention and in the Local Standard of Rest frame, in units of km s−1) and intensity ranges of the spectra (in the main beam temperature scale, Tmb, in units of mK) are also indicated in the lower right corner.
Current usage metrics show cumulative count of Article Views (full-text article views including HTML views, PDF and ePub downloads, according to the available data) and Abstracts Views on Vision4Press platform.
Data correspond to usage on the plateform after 2015. The current usage metrics is available 48-96 hours after online publication and is updated daily on week days.
Initial download of the metrics may take a while.