Fig. 6.
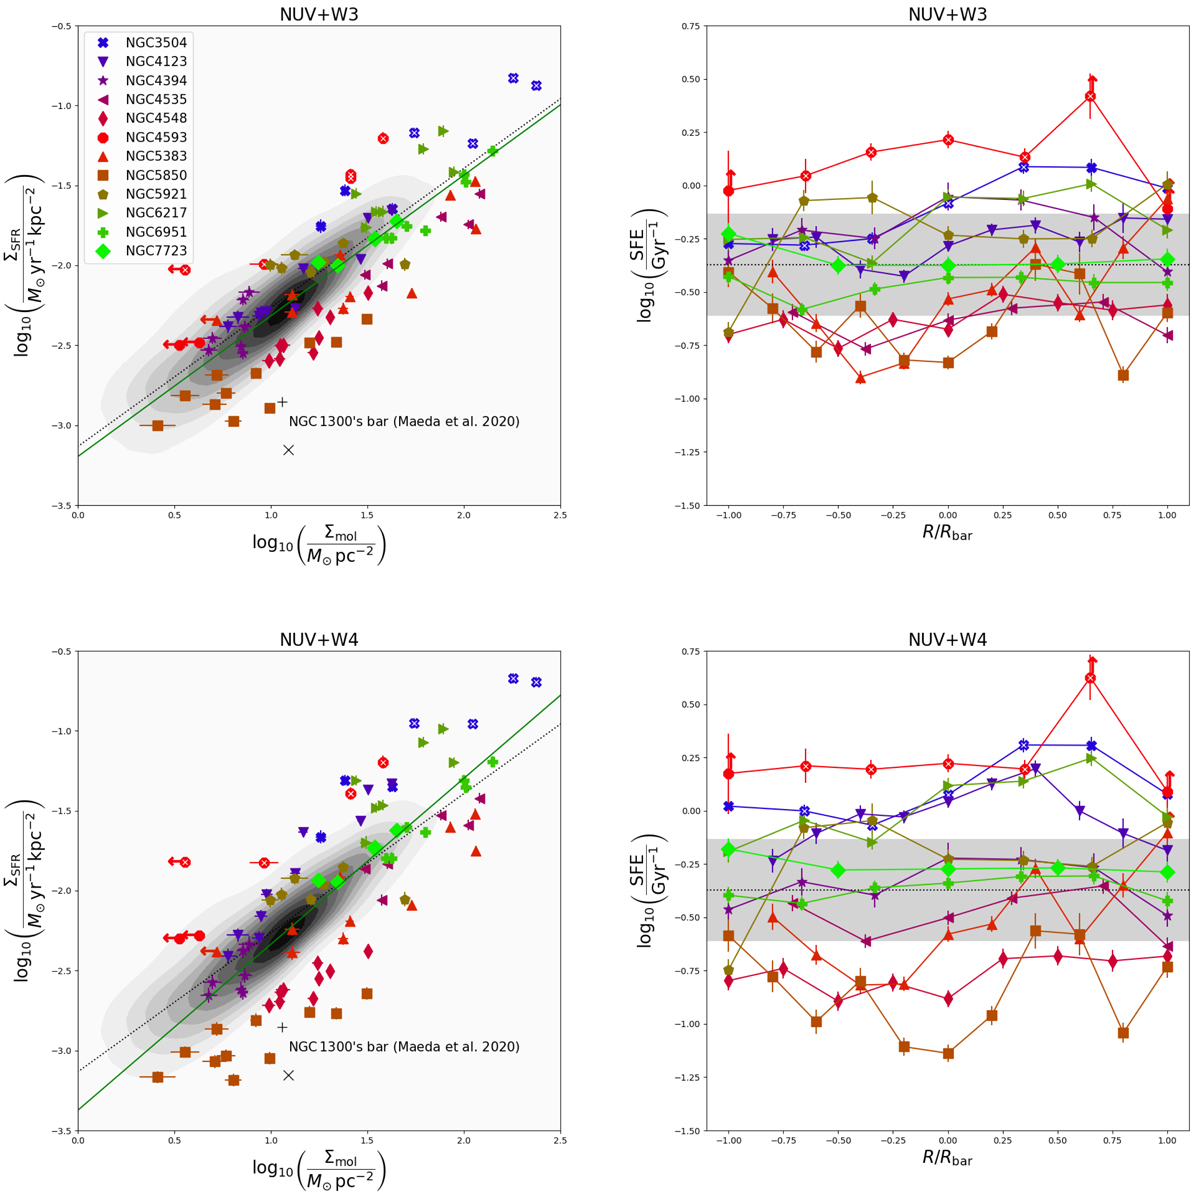
Download original image
Kennicutt-Schmidt law and star formation efficiency within bars. Left panels: star formation rate surface density traced from NUV combined with WISE 3 (upper panels) and WISE 4 (lower panels) vs molecular gas surface density, traced from the CO(1–0) emission. The colour palette and symbols indicate different galaxies (see legend). The grey contours show the measurements from Bigiel et al. (2011), obtained from FUV and 22 μm images, whose linear fit is also shown with a black dotted line. The white x symbols indicate those points with high W2–W1 (Fig. 5) that may correspond to less reliable SFR estimates due to AGNs. The leftward arrows correspond to the pointings with no CO(1–0) detection (Eq. (5)). The green line corresponds to the linear fit to the cloud of points. The grey cross and x symbol indicate the ΣSFR and Σmol values at the bar region of NGC 1300 reported by Maeda et al. (2020) from the combination of FUV and W4 (‘Bar-A’ and ‘Bar-B’ in their Table B.1). Right panels: profiles along the bar major axis of star formation efficiency. The grey rectangle traces the median SFE (black dotted line) plus or minus 1σ from Bigiel et al. (2011).
Current usage metrics show cumulative count of Article Views (full-text article views including HTML views, PDF and ePub downloads, according to the available data) and Abstracts Views on Vision4Press platform.
Data correspond to usage on the plateform after 2015. The current usage metrics is available 48-96 hours after online publication and is updated daily on week days.
Initial download of the metrics may take a while.