Fig. 7.
Download original image
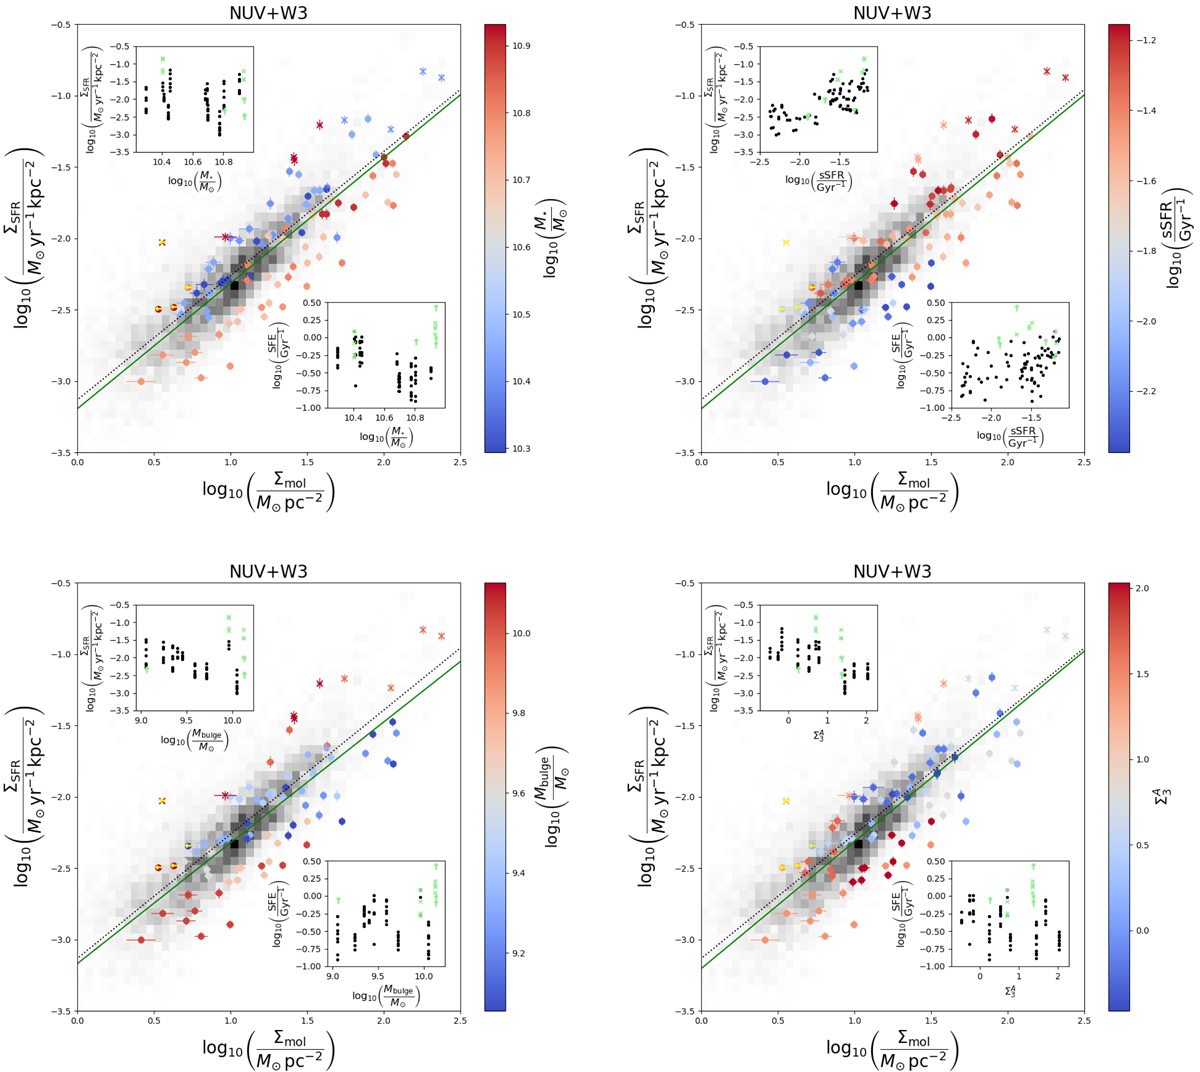
Same as left panel of Fig. 6, but the colour-coding (see colour bars on the right) indicates the total stellar mass of the host galaxy (top left), the specific star formation of each aperture along the bars (top right), the bulge stellar mass (bottom left), and the projected surface density to the third-nearest neighbour galaxy (bottom right). The background black and grey density plots trace the measurements from Bigiel et al. (2011). The x symbols indicate pointings whose elevated W2–W1 colours suggest the presence of AGNs. The insets show ΣSFR (upper left corners) and SFE (lower right corners) vs the parameters used for the colour-coding of the main plot; black solid points correspond to the pointings with CO(1–0) detection whose WISE colours lie in the SF sequence, while non-detections and AGN candidates are respectively highlighted with green x symbols and arrows (i.e., less reliable SFEs and SFRs).
Current usage metrics show cumulative count of Article Views (full-text article views including HTML views, PDF and ePub downloads, according to the available data) and Abstracts Views on Vision4Press platform.
Data correspond to usage on the plateform after 2015. The current usage metrics is available 48-96 hours after online publication and is updated daily on week days.
Initial download of the metrics may take a while.