Fig. 8.
Download original image
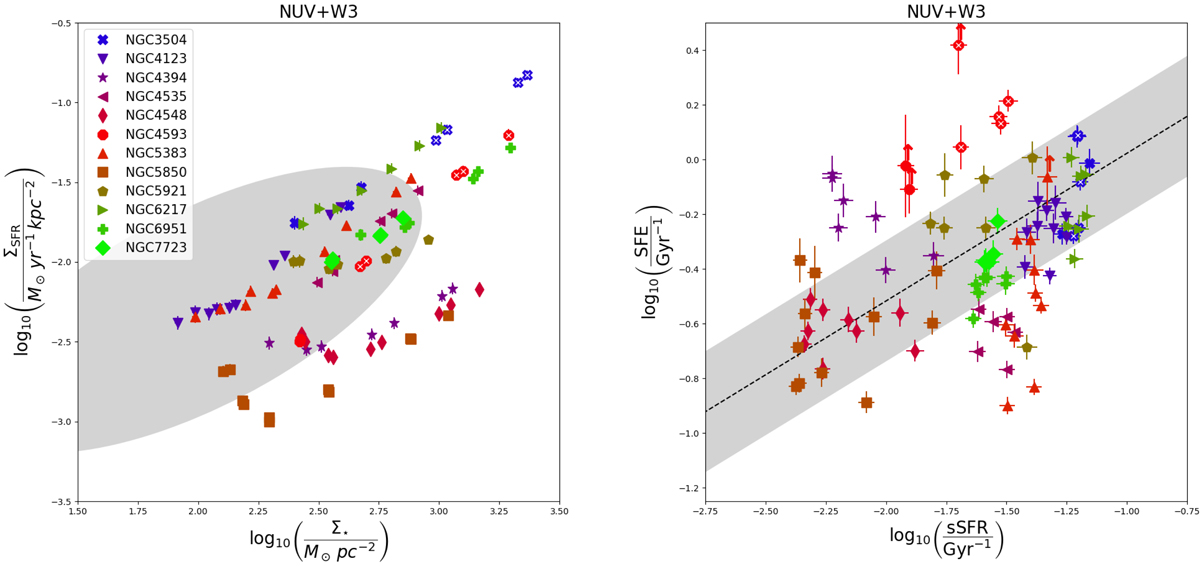
Scaling relations involving surface densities of stellar mass, molecular gas mass, and star formation rate. Left: star-forming main sequence measured within the CO pointings covering the bars, for each galaxy in our sample (see legend). Star formation rates are calculated from the combination of NUV and WISE 3 images (Eq. (10)), while stellar masses are estimated from WISE 1 images (Eq. (13)). The grey ellipse corresponds to the spatially resolved main sequence reported by Ellison et al. (2018), traced from their Fig. 4 (see Rosado-Belza et al. 2019), based on Mapping Nearby Galaxies at APO (MaNGA; Bundy et al. 2015). Right: star formation efficiency vs specific star formation. The grey area corresponds to the best fit (black dotted line) reported by Saintonge et al. (2011, COLD GASS, see their Table 1; we only use their secure detections) plus or minus 1σ. For the sake of consistency, we add the mass of helium and heavy metals (×1.36) to the molecular gas masses used to calculate SFEs in COLD GASS. The colours and symbols are the same as in Fig. 6.
Current usage metrics show cumulative count of Article Views (full-text article views including HTML views, PDF and ePub downloads, according to the available data) and Abstracts Views on Vision4Press platform.
Data correspond to usage on the plateform after 2015. The current usage metrics is available 48-96 hours after online publication and is updated daily on week days.
Initial download of the metrics may take a while.