Fig. 9.
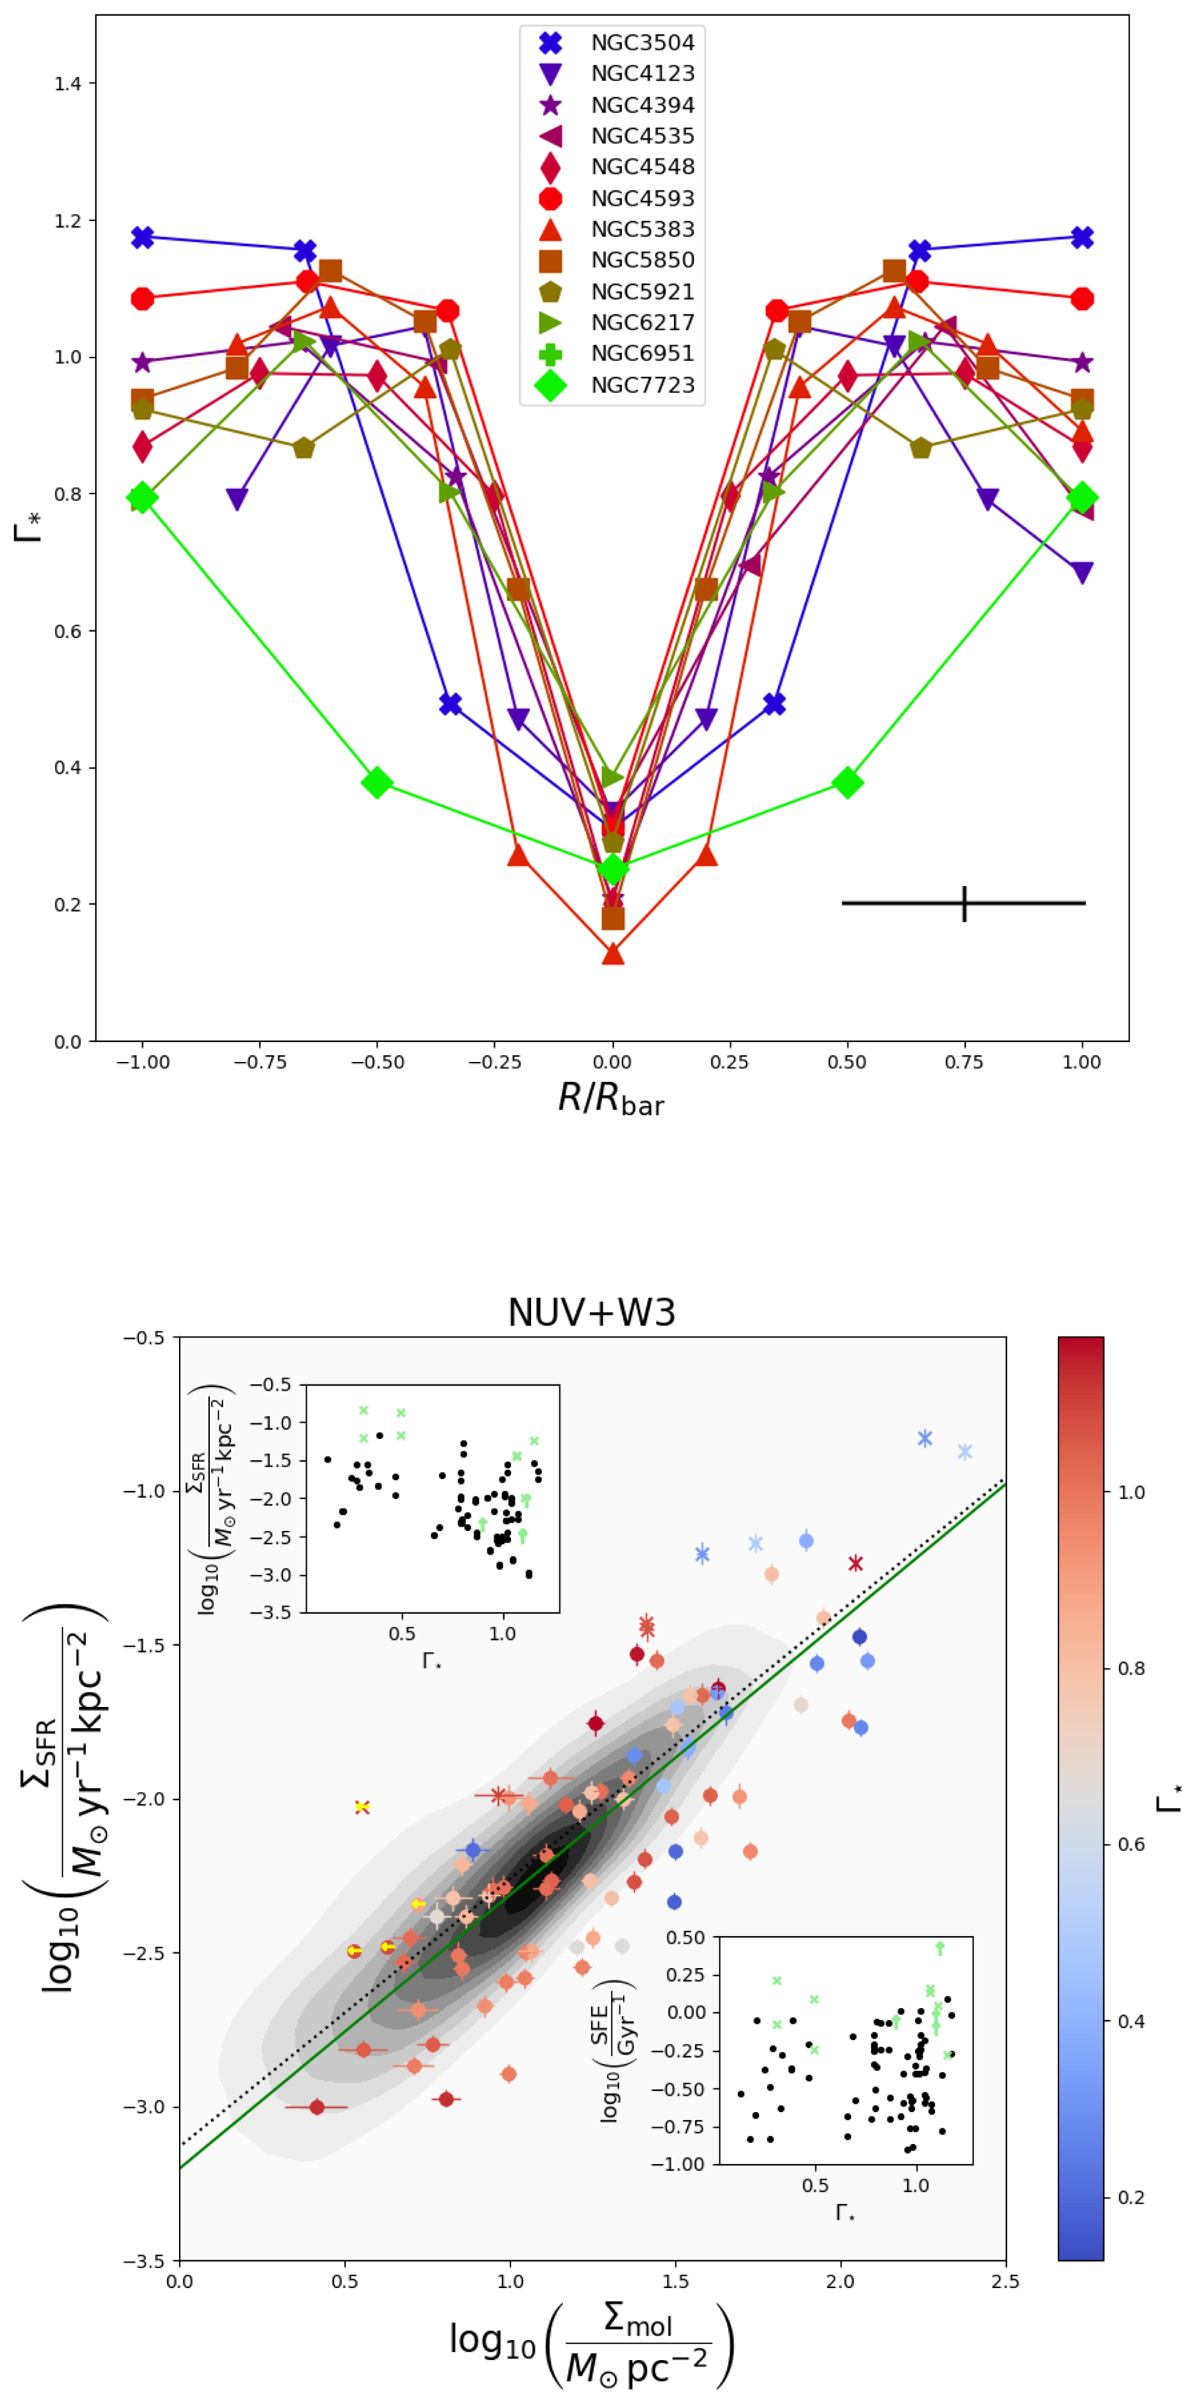
Download original image
Shear and its connection to star formation. Upper panel: shear evaluated from the stellar component of the circular velocity within each IRAM-30 m aperture as a function of the radius along the bar major axis. The black cross indicates the mean bar range covered by the IRAM-30 m pointings (x-axis, i.e., FWHM/Rbar) and error on Γ⋆. The latter corresponds to a 13% typical uncertainty on the slope of the disk+bulge rotation curve (Díaz-García et al. 2016b), which is associated with the uncertainty on the disk thickness determination. Lower panel: as in Fig. 7, but colour-coded by the stellar contribution to the shear. The grey contours show the measurements from Bigiel et al. (2011).
Current usage metrics show cumulative count of Article Views (full-text article views including HTML views, PDF and ePub downloads, according to the available data) and Abstracts Views on Vision4Press platform.
Data correspond to usage on the plateform after 2015. The current usage metrics is available 48-96 hours after online publication and is updated daily on week days.
Initial download of the metrics may take a while.