Free Access
Fig. 7.
Download original image
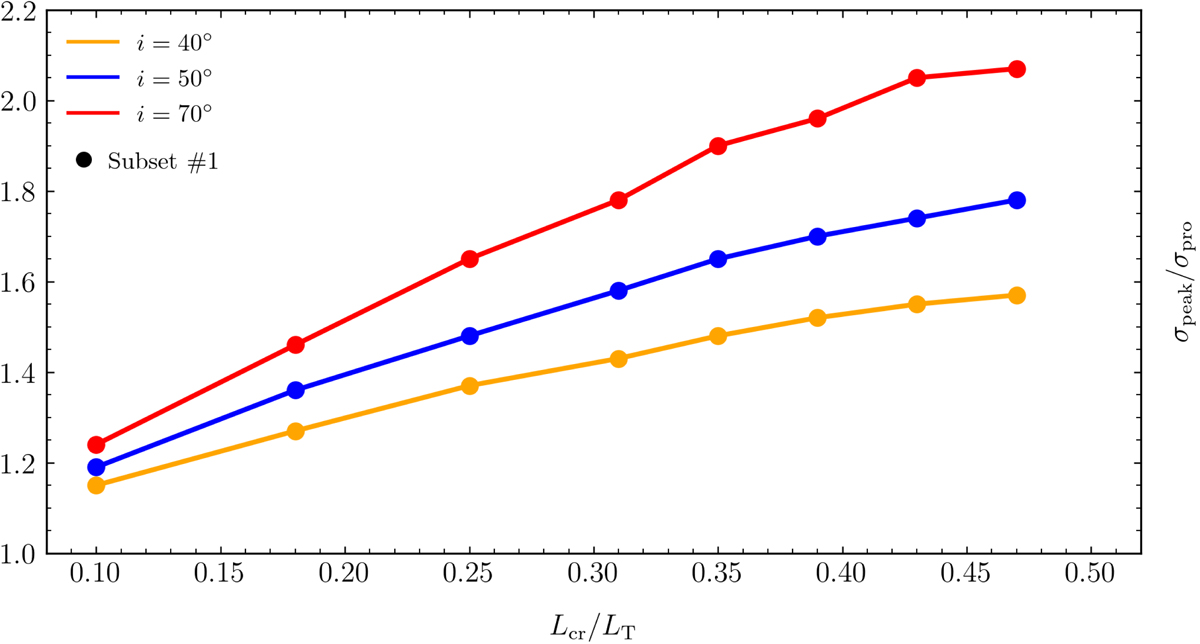
Ratio of the peak velocity dispersion σpeak to the input velocity dispersion σpro as a function of the ratio of the total luminosity of the counter-rotating component Lcr to that of the model LT for subset 1 (filled circles). The yellow, blue, and red lines show the trend for inclination i = 40° ,50°, and 70°, respectively.
Current usage metrics show cumulative count of Article Views (full-text article views including HTML views, PDF and ePub downloads, according to the available data) and Abstracts Views on Vision4Press platform.
Data correspond to usage on the plateform after 2015. The current usage metrics is available 48-96 hours after online publication and is updated daily on week days.
Initial download of the metrics may take a while.