Fig. 1.
Download original image
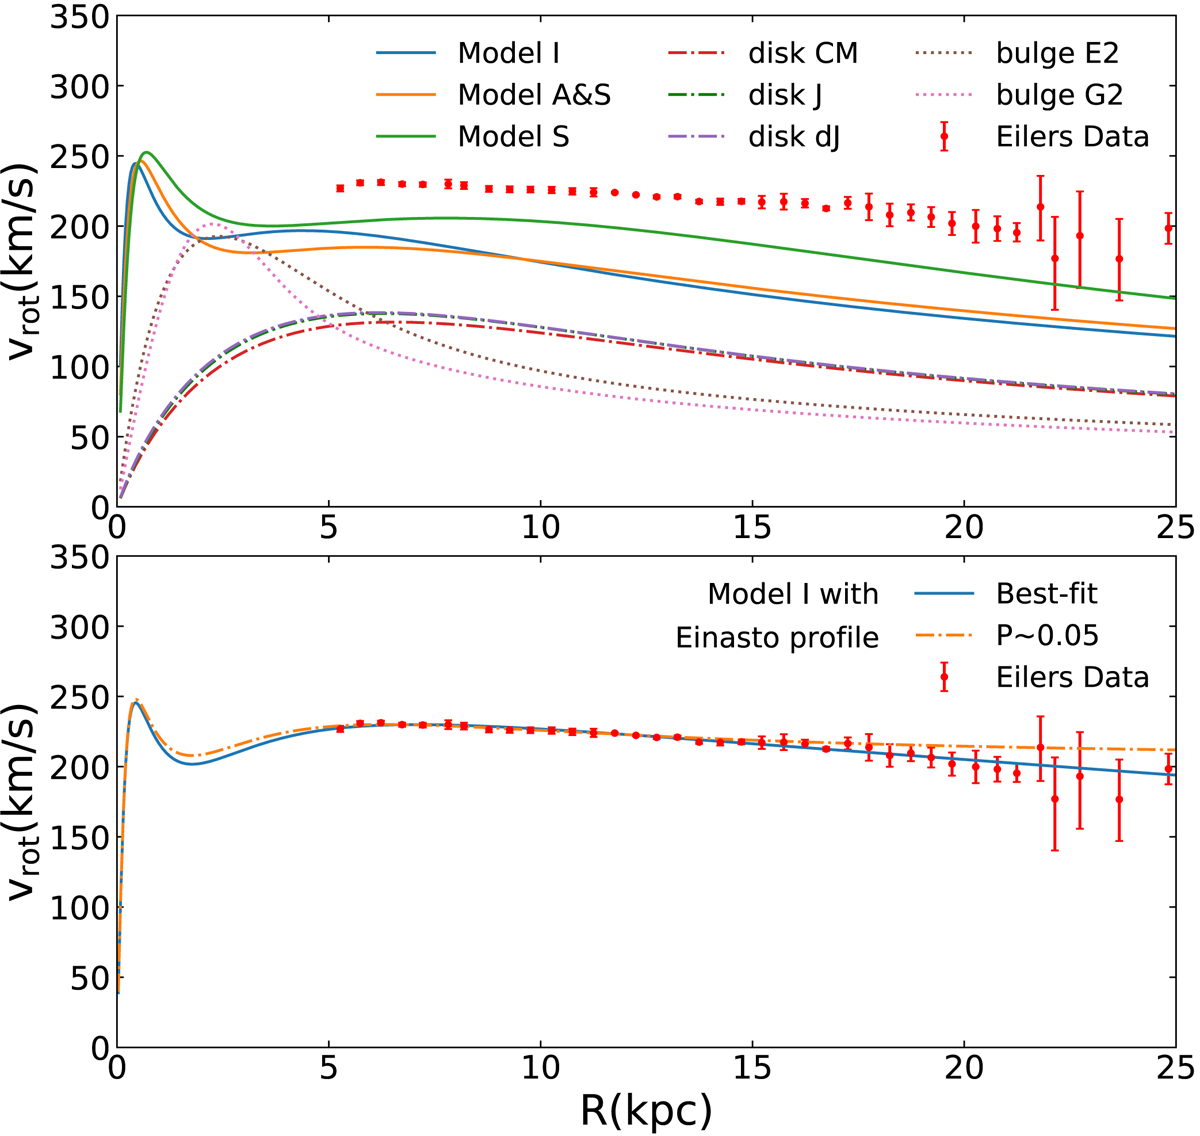
Top: contribution to the rotation curve of different baryonic models and model components. Red points indicate the rotation curve of the Milky Way from Eilers et al. (2019). The error bars are estimated by bootstrapping and include the systematic uncertainties from the neglected term (see text). Bottom: fit of the rotation curve by the best-fit model (solid blue curve, total mass of 2.8 × 10¹¹ M⊙), and with the most massive MW model for which the χ2 probability reaches P = 0.05 (dash-dotted orange line, total mass of 18 × 1011 M⊙), both associated with the baryonic distribution from model I of Pouliasis et al. (2017).
Current usage metrics show cumulative count of Article Views (full-text article views including HTML views, PDF and ePub downloads, according to the available data) and Abstracts Views on Vision4Press platform.
Data correspond to usage on the plateform after 2015. The current usage metrics is available 48-96 hours after online publication and is updated daily on week days.
Initial download of the metrics may take a while.