Fig. 12
Download original image
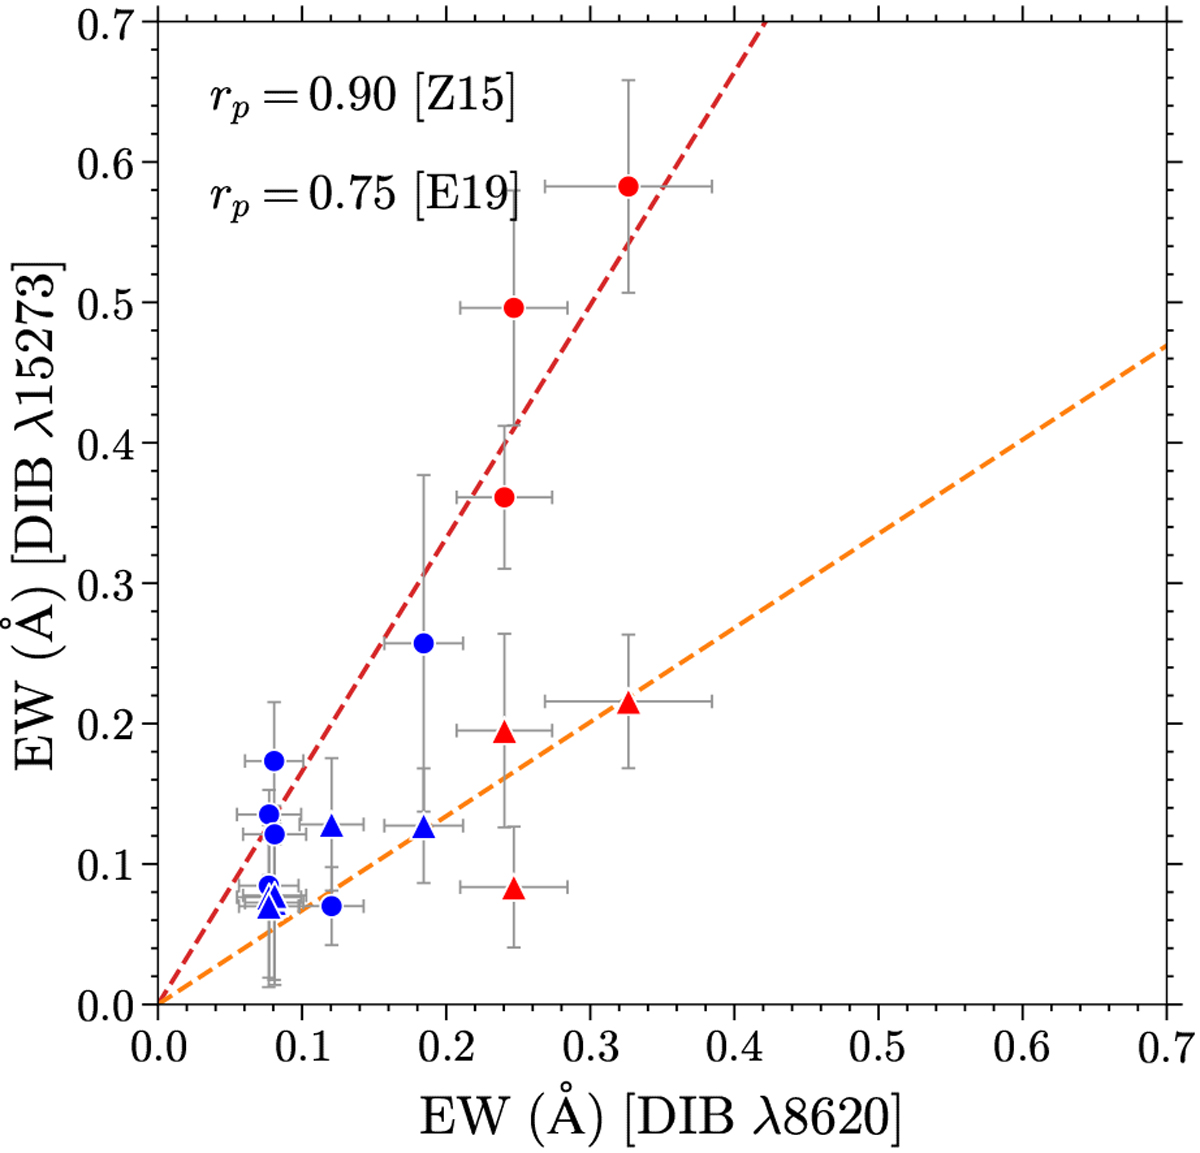
Median EW comparison between DIB λ8620 and DIB λ15273 for GIBS (red) and GES (blue) fields. Filled circles indicate the DIB λ15273 measured by Zasowski et al. (2015) and triangles by Elyajouri & Lallement (2019). The dashed red line is the fit between the GIBS∕GES sample and the Zasowski et al. (2015) sample, and the dashed orange line between GIBS∕GES and Elyajouri & Lallement (2019). The error bars represent the standard deviation in each field. The Pearson correlation coefficients (rp) are also indicated.
Current usage metrics show cumulative count of Article Views (full-text article views including HTML views, PDF and ePub downloads, according to the available data) and Abstracts Views on Vision4Press platform.
Data correspond to usage on the plateform after 2015. The current usage metrics is available 48-96 hours after online publication and is updated daily on week days.
Initial download of the metrics may take a while.