Open Access
Fig. 7
Download original image
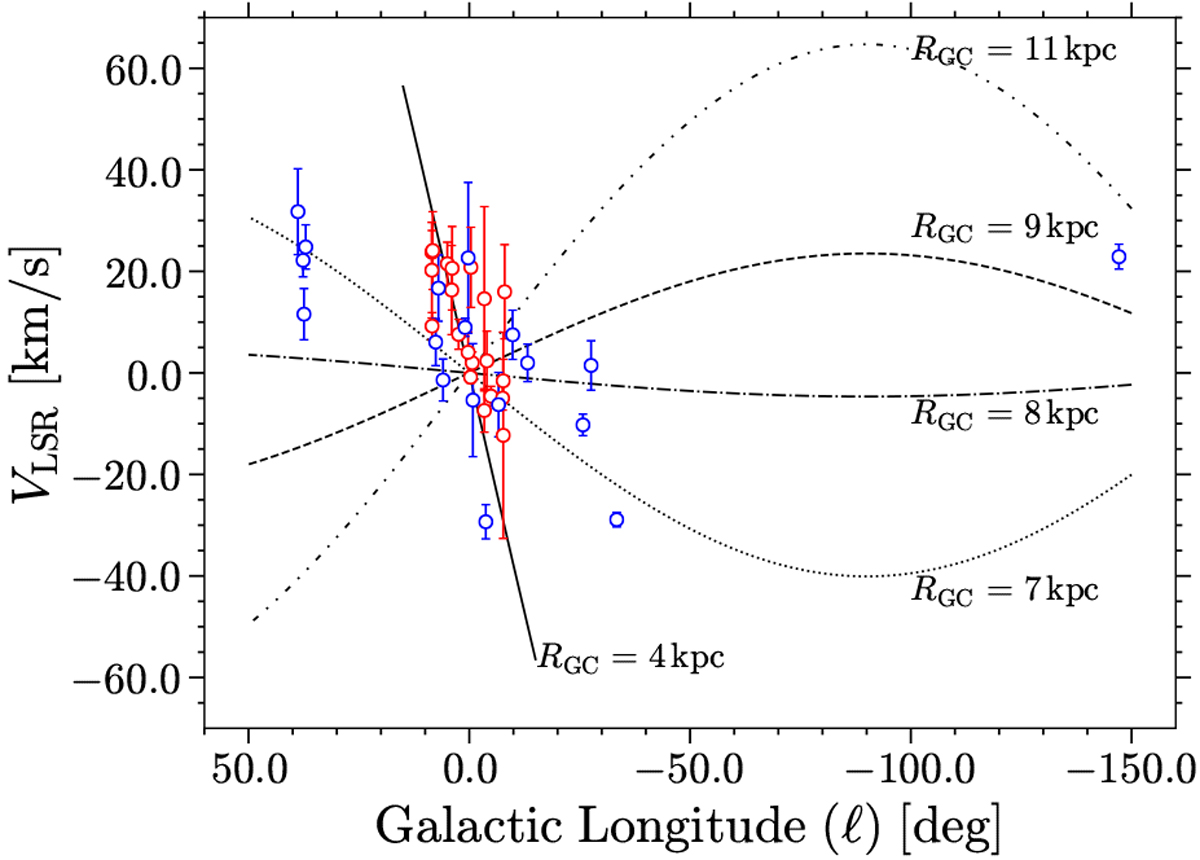
Longitude–velocity (ℓ − VLSR) diagram for the GIBS (red) and GES (blue) fields, respectively. The circles indicate the median VLSR and standard error of the mean for each field. Velocity curves calculated by Model A5 in Reid et al. (2019) for different galactocentric distances (RGC) are overplotted.
Current usage metrics show cumulative count of Article Views (full-text article views including HTML views, PDF and ePub downloads, according to the available data) and Abstracts Views on Vision4Press platform.
Data correspond to usage on the plateform after 2015. The current usage metrics is available 48-96 hours after online publication and is updated daily on week days.
Initial download of the metrics may take a while.