Fig. 5.
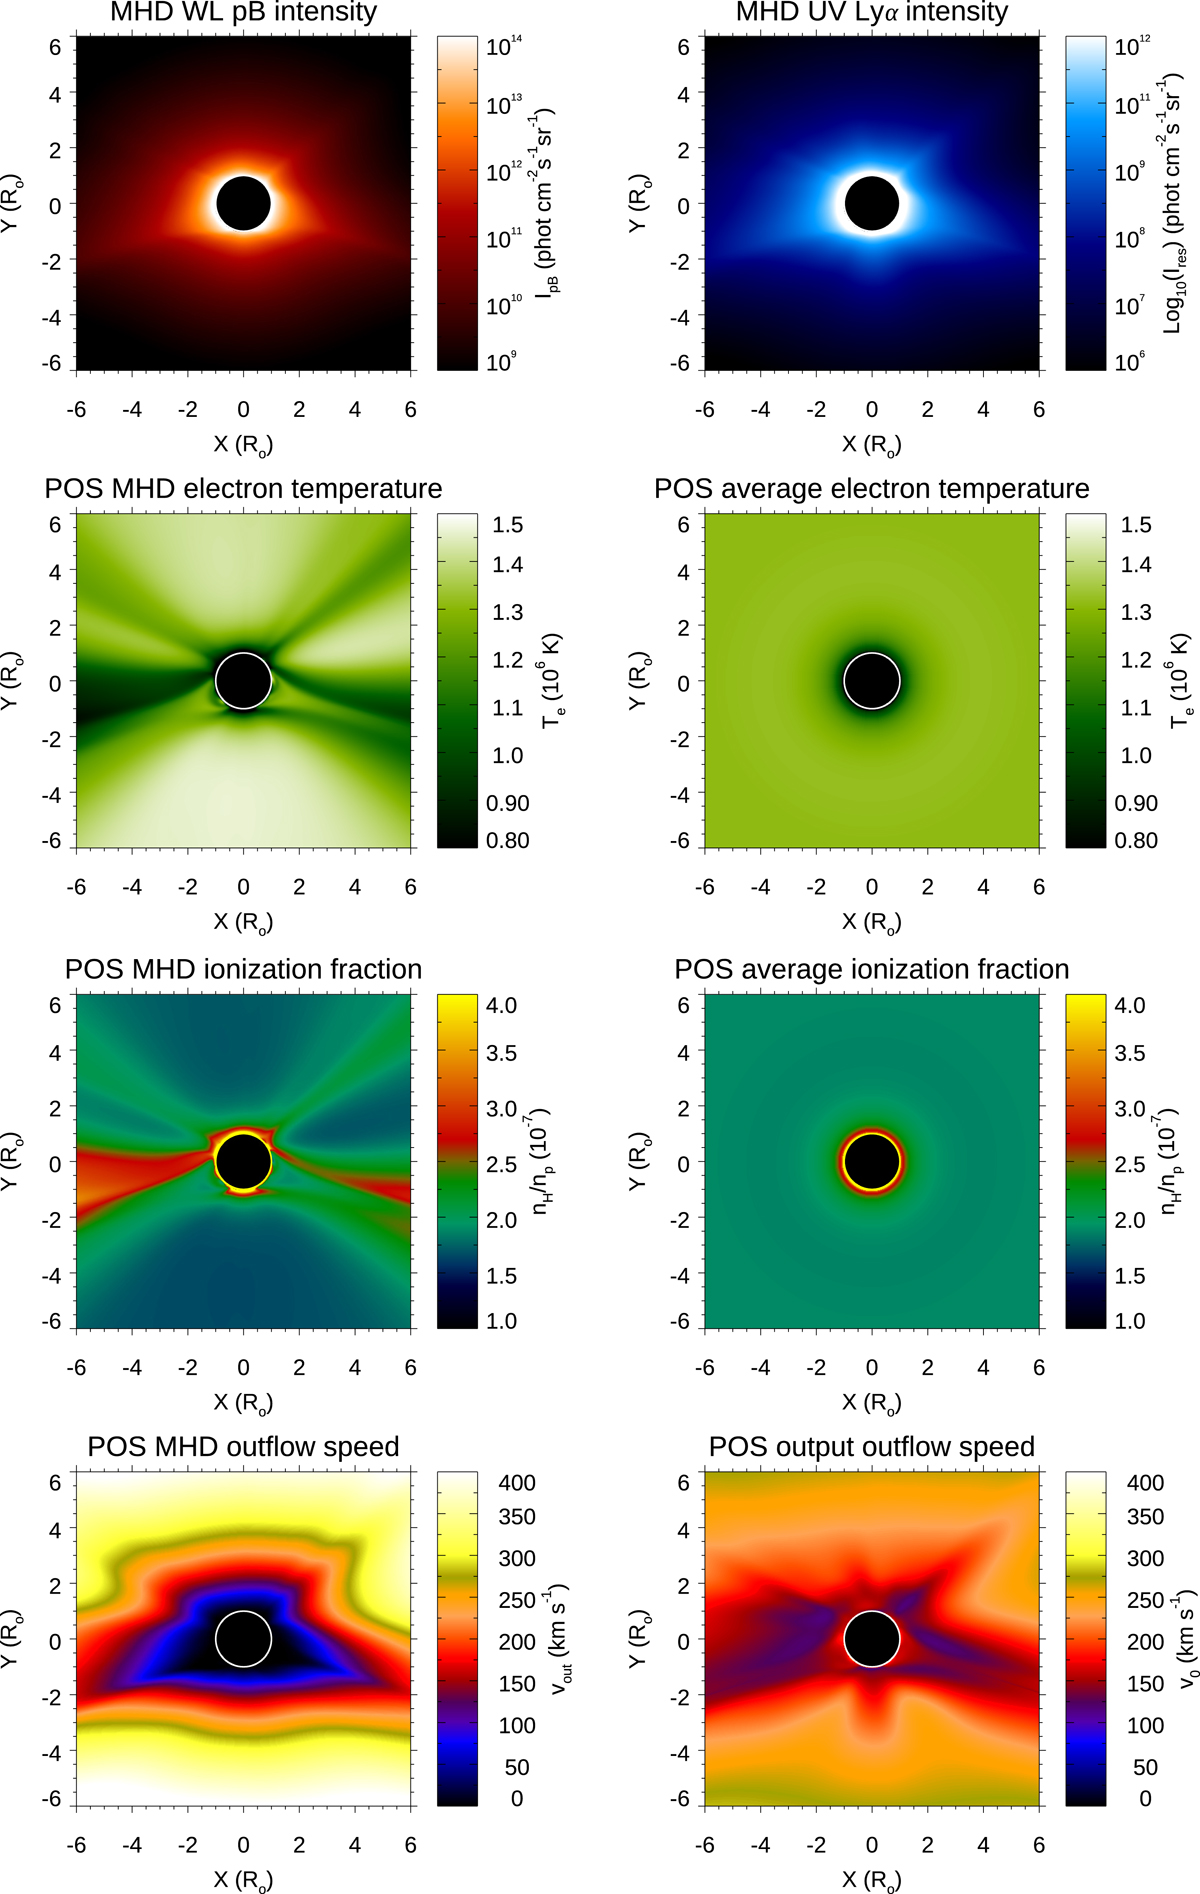
Download original image
Simulation performed close to the minimum of solar activity cycle. From top to bottom, and from left to right: synthetic WL (pB) and UV (Lyα) images, the POS temperature distribution and the resulting averaged profile, the corresponding POS distribution of neutral H atoms and the resulting averaged distribution, and input and output outflow speeds on the POS.
Current usage metrics show cumulative count of Article Views (full-text article views including HTML views, PDF and ePub downloads, according to the available data) and Abstracts Views on Vision4Press platform.
Data correspond to usage on the plateform after 2015. The current usage metrics is available 48-96 hours after online publication and is updated daily on week days.
Initial download of the metrics may take a while.