Free Access
Fig. 8.
Download original image
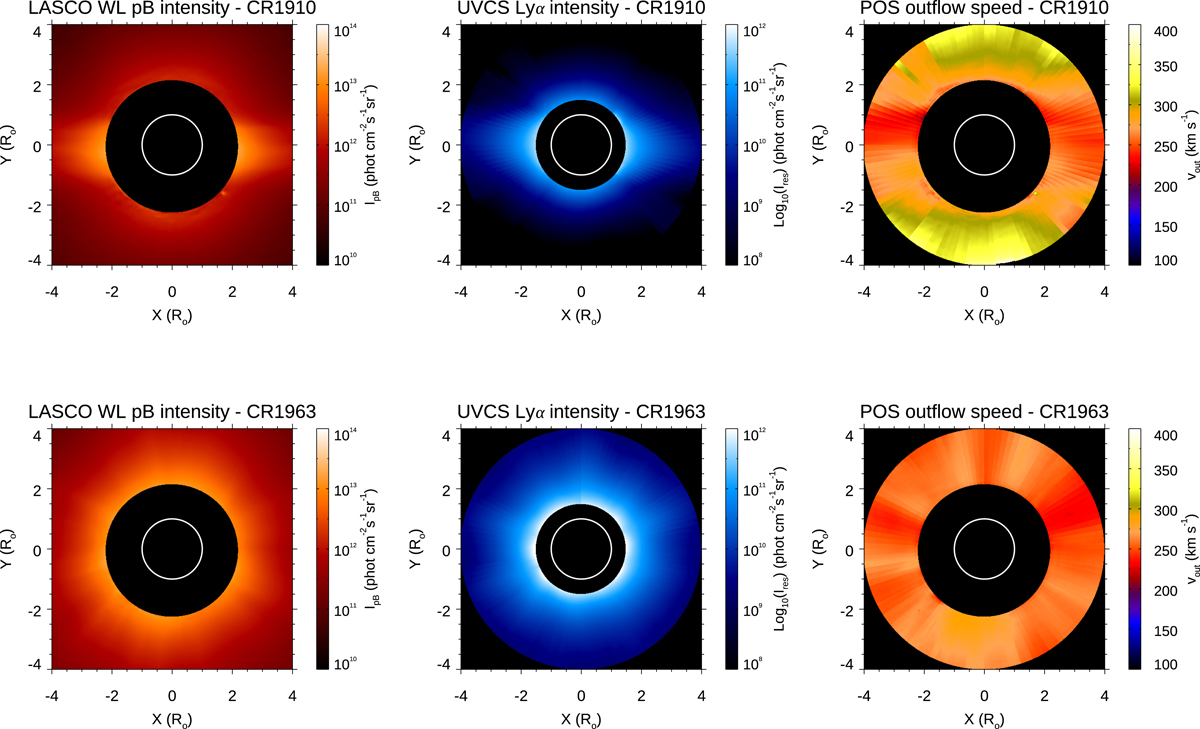
Average LASCO WL pB (left panels) and UV Lyα (middle panels) images obtained for Carrington rotations 1910 (top row) and 1963 (bottom row), and the corresponding distribution of POS speeds as derived with the quick inversion method (right panels).
Current usage metrics show cumulative count of Article Views (full-text article views including HTML views, PDF and ePub downloads, according to the available data) and Abstracts Views on Vision4Press platform.
Data correspond to usage on the plateform after 2015. The current usage metrics is available 48-96 hours after online publication and is updated daily on week days.
Initial download of the metrics may take a while.