Fig. 1.
Download original image
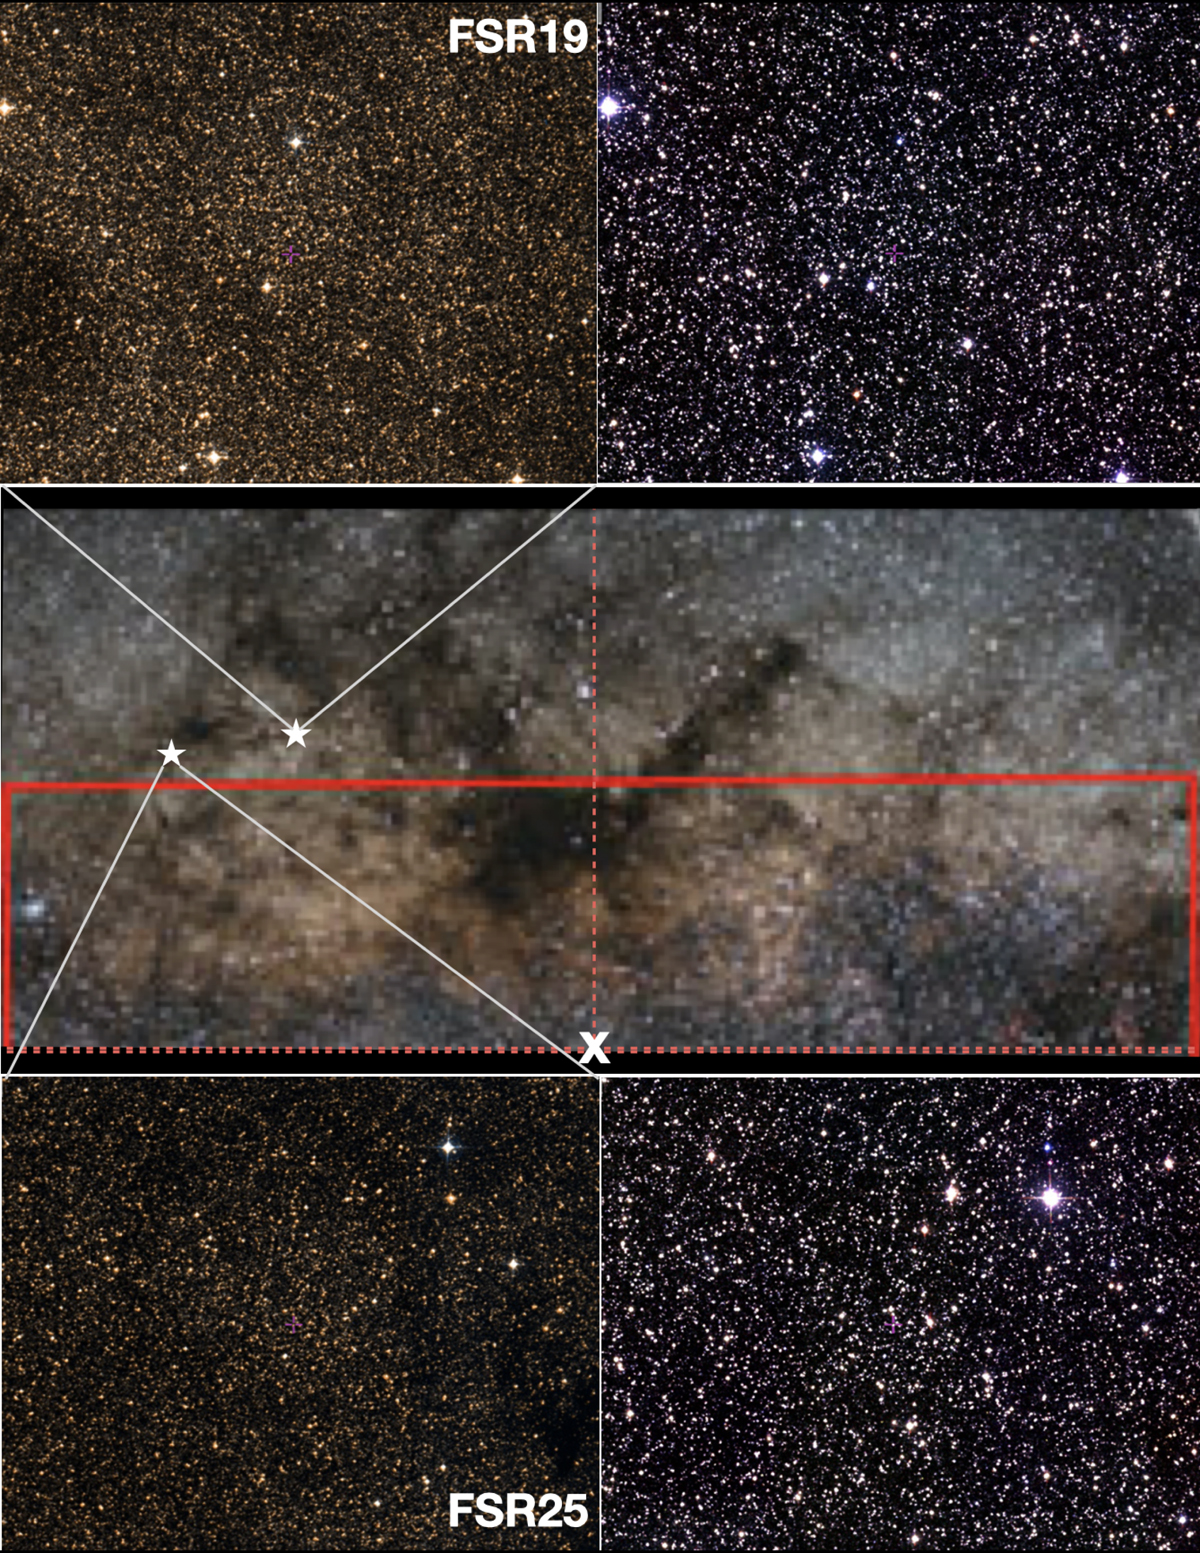
Zoomed-in image of the clusters in both optical (left) and near IR (right) for FSR 19 (upper frame) and FSR 25 (bottom frame). The middle frame shows the complex bulge region where the clusters are located. The position of the Galactic centre is shown with a white X. The red rectangle is the region covered by the VVV Survey, and the top part corresponds to the extension VVVX. The total field of view shown is 20X10 sqdeg. The Galactic major and minor axes are shown with dotted red lines.
Current usage metrics show cumulative count of Article Views (full-text article views including HTML views, PDF and ePub downloads, according to the available data) and Abstracts Views on Vision4Press platform.
Data correspond to usage on the plateform after 2015. The current usage metrics is available 48-96 hours after online publication and is updated daily on week days.
Initial download of the metrics may take a while.