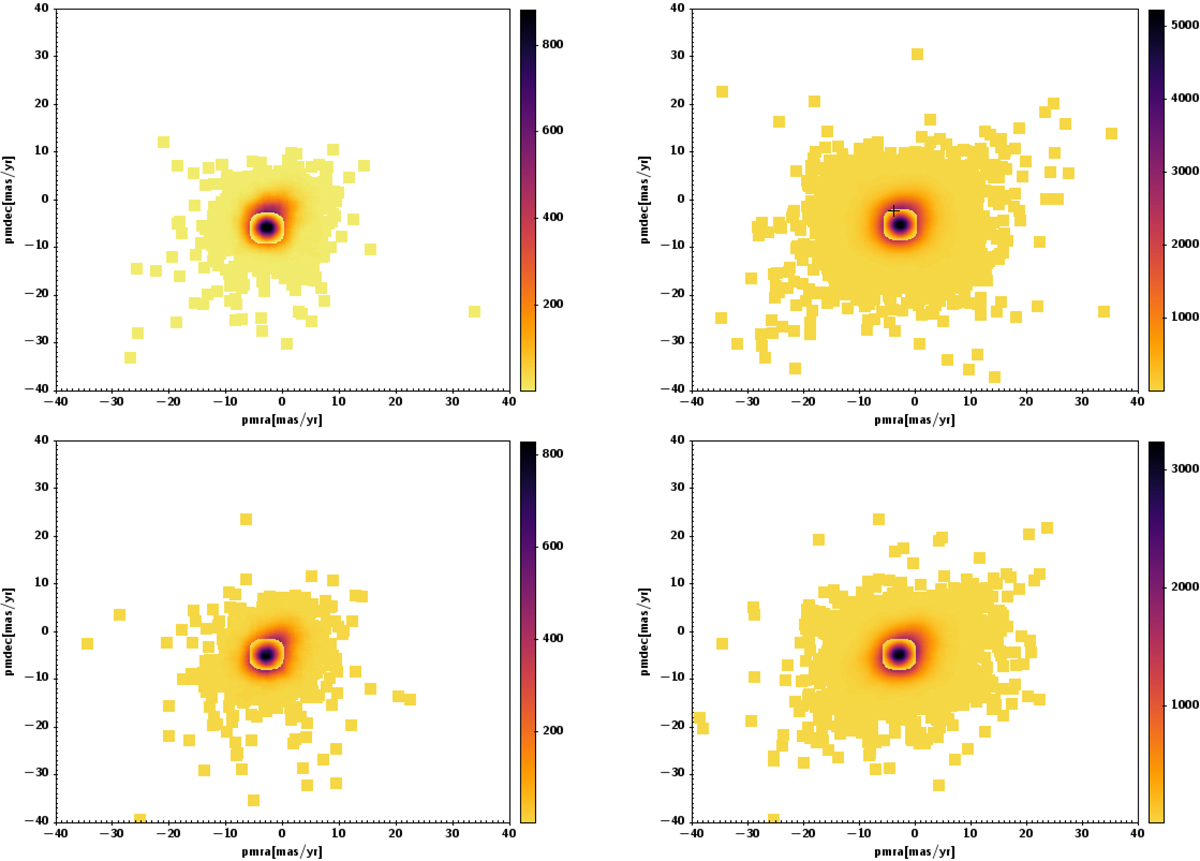
Fig. 2.
Download original image
Vector PM diagrams for the bright sources (Ks < 12 mag) matched with the 2MASS+Gaia catalogues and the fainter sources (Ks > 12 mag) matched with VVVX+Gaia catalogues (upper frame FSR 19 and bottom frame FSR 25). The yellow region shows the cluster selection and the black cross in upper right frame represents the RR Lyrae found within 5′ of the FSR 19 cluster. The colour bars indicate the concentration level.
Current usage metrics show cumulative count of Article Views (full-text article views including HTML views, PDF and ePub downloads, according to the available data) and Abstracts Views on Vision4Press platform.
Data correspond to usage on the plateform after 2015. The current usage metrics is available 48-96 hours after online publication and is updated daily on week days.
Initial download of the metrics may take a while.