Free Access
Fig. 3.
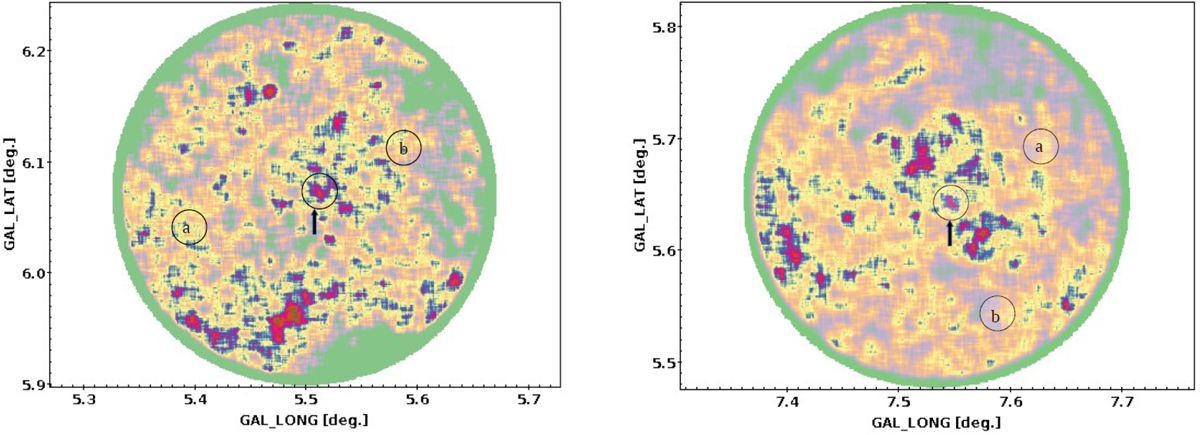
Download original image
Gaia stellar density map for r = 1.2′ is shown in the Galactic coordinates indicating the positions of the two clusters (FSR 19 left and FSR 25 right) with an arrow. The comparison fields are also represented with a and b.
Current usage metrics show cumulative count of Article Views (full-text article views including HTML views, PDF and ePub downloads, according to the available data) and Abstracts Views on Vision4Press platform.
Data correspond to usage on the plateform after 2015. The current usage metrics is available 48-96 hours after online publication and is updated daily on week days.
Initial download of the metrics may take a while.