Free Access
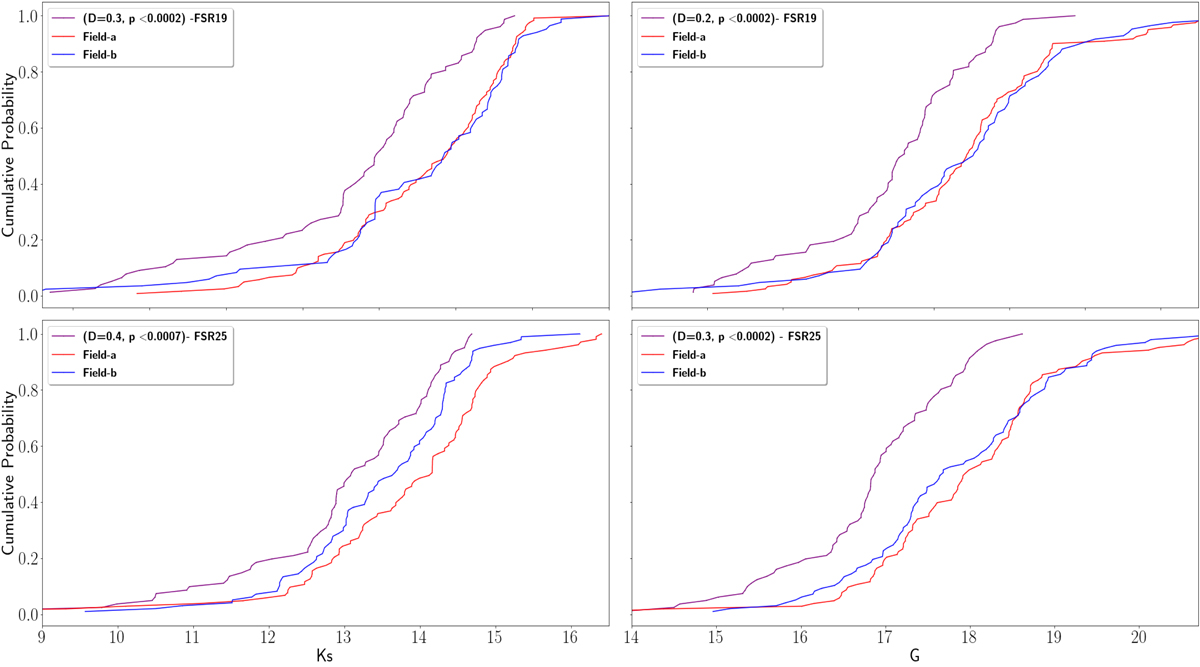
Fig. 5.
Download original image
Cumulative probability of both targets’ clusters are shown with their respective comparison fields. For FSR 19, the fluctuations in the background comparison fields seem fairly uniform and vary in the field of FSR 25. The D statistic and calculated p value are shown in the legend of each panel.
Current usage metrics show cumulative count of Article Views (full-text article views including HTML views, PDF and ePub downloads, according to the available data) and Abstracts Views on Vision4Press platform.
Data correspond to usage on the plateform after 2015. The current usage metrics is available 48-96 hours after online publication and is updated daily on week days.
Initial download of the metrics may take a while.