Fig. C.2
Download original image
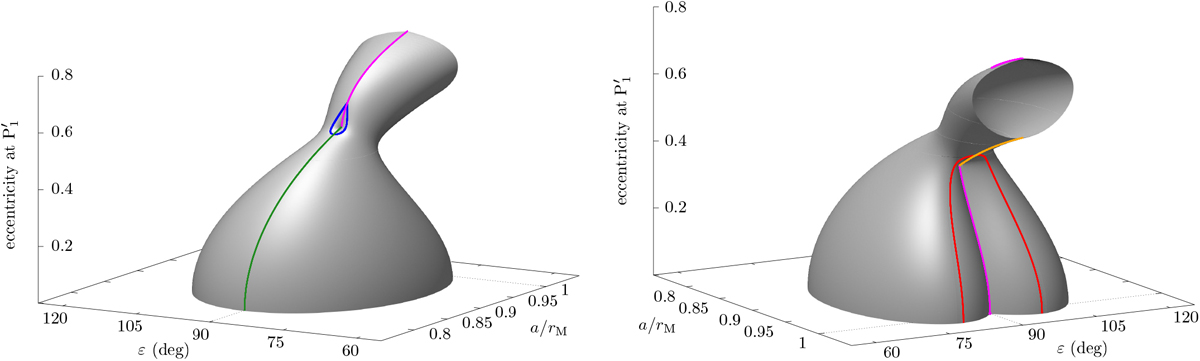
Eccentricity e of the satellite at equilibrium P![]() as a function of the parameters. The solutions lie on a three-dimensional surface shown here from two viewing angles. This figure is obtained by stitching together the patches represented in Fig. C.1. For better comparison, the dividing curves are drawn on the surface using the same colour code. The top tube-like portion of the surface has been cut; as shown in Fig. C.1, it extends up to a → ∞ (i.e. u → 0). The equilibrium P
as a function of the parameters. The solutions lie on a three-dimensional surface shown here from two viewing angles. This figure is obtained by stitching together the patches represented in Fig. C.1. For better comparison, the dividing curves are drawn on the surface using the same colour code. The top tube-like portion of the surface has been cut; as shown in Fig. C.1, it extends up to a → ∞ (i.e. u → 0). The equilibrium P![]() is singular along the magenta curve, called
is singular along the magenta curve, called ![]() in the text.
in the text.
Current usage metrics show cumulative count of Article Views (full-text article views including HTML views, PDF and ePub downloads, according to the available data) and Abstracts Views on Vision4Press platform.
Data correspond to usage on the plateform after 2015. The current usage metrics is available 48-96 hours after online publication and is updated daily on week days.
Initial download of the metrics may take a while.