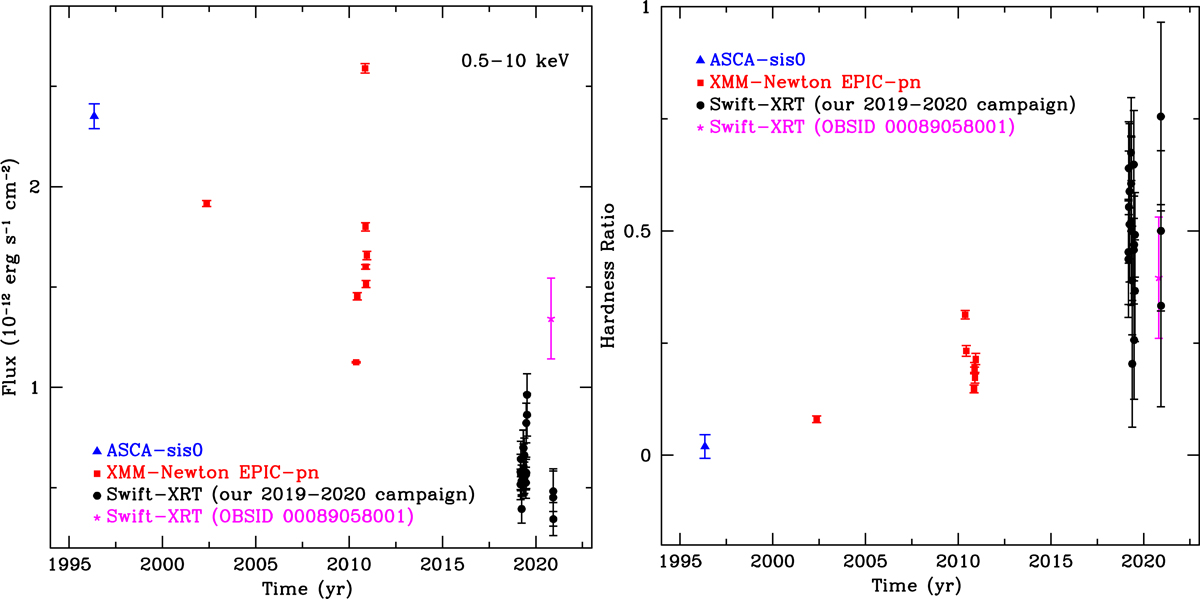
Fig. 2.
Download original image
Full-band (E = 0.5−10 keV) light curve using ASCA data (blue triangle), XMM-Newton (red squares), our Swift-XRT campaign (black circles), and additional archival Swift-XRT observation (magenta star; left). Time variability of the hardness ratio HR = (H − S)/(H + S), where S and H are the 0.5 − 2 and 2 − 10 keV count rates, respectively (left). The spectrum in the most recent data is noticeably harder. The count rates of the ASCA and EPIC-pn observations were converted into Swift-XRT count rates following the procedure described in Sect. 3.
Current usage metrics show cumulative count of Article Views (full-text article views including HTML views, PDF and ePub downloads, according to the available data) and Abstracts Views on Vision4Press platform.
Data correspond to usage on the plateform after 2015. The current usage metrics is available 48-96 hours after online publication and is updated daily on week days.
Initial download of the metrics may take a while.