Free Access
Fig. 3.
Download original image
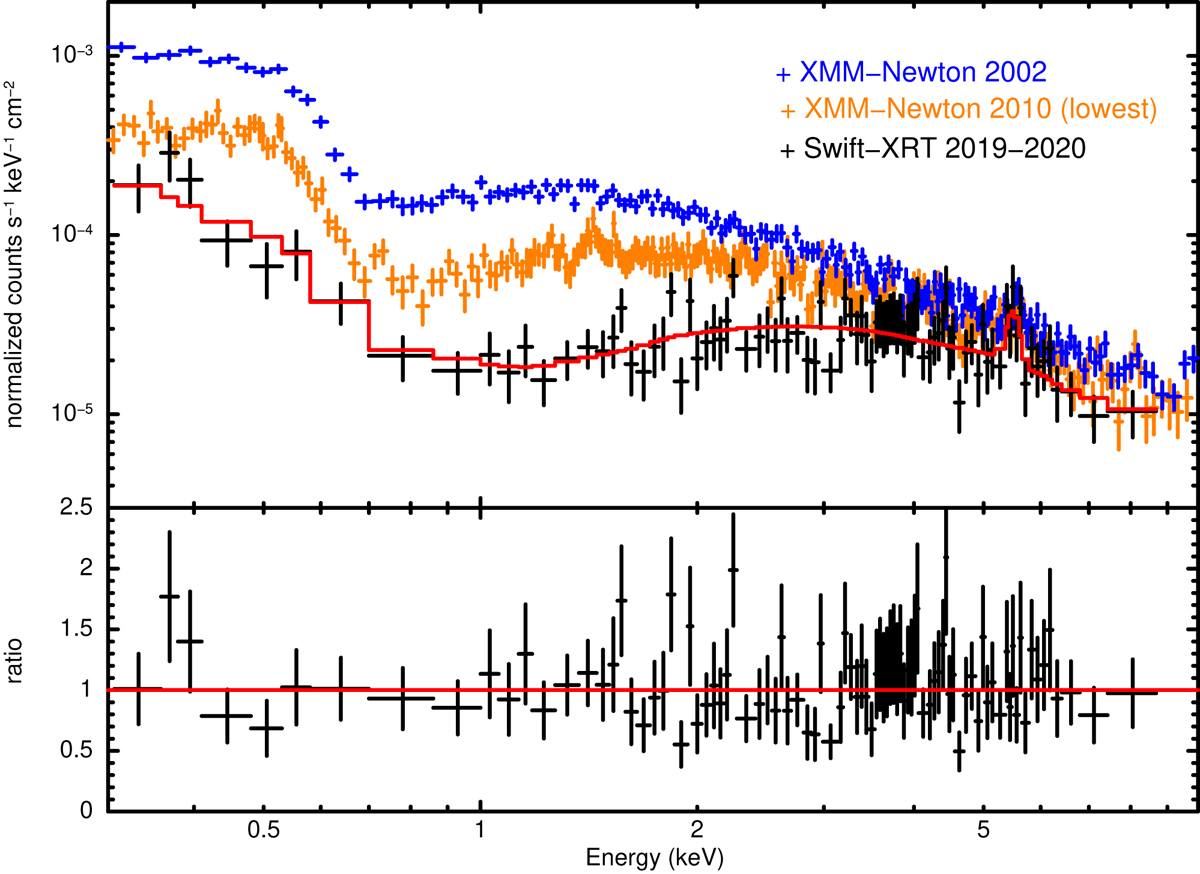
Composite Swift-XRT spectrum (black) with its best-fit model (upper panel) and data-to-model ratios (lower panel). For comparison, we also show the 2002 EPIC-pn observation (blue) and the lowest-flux spectrum of the 2010 campaign (orange).
Current usage metrics show cumulative count of Article Views (full-text article views including HTML views, PDF and ePub downloads, according to the available data) and Abstracts Views on Vision4Press platform.
Data correspond to usage on the plateform after 2015. The current usage metrics is available 48-96 hours after online publication and is updated daily on week days.
Initial download of the metrics may take a while.