Fig. 5.
Download original image
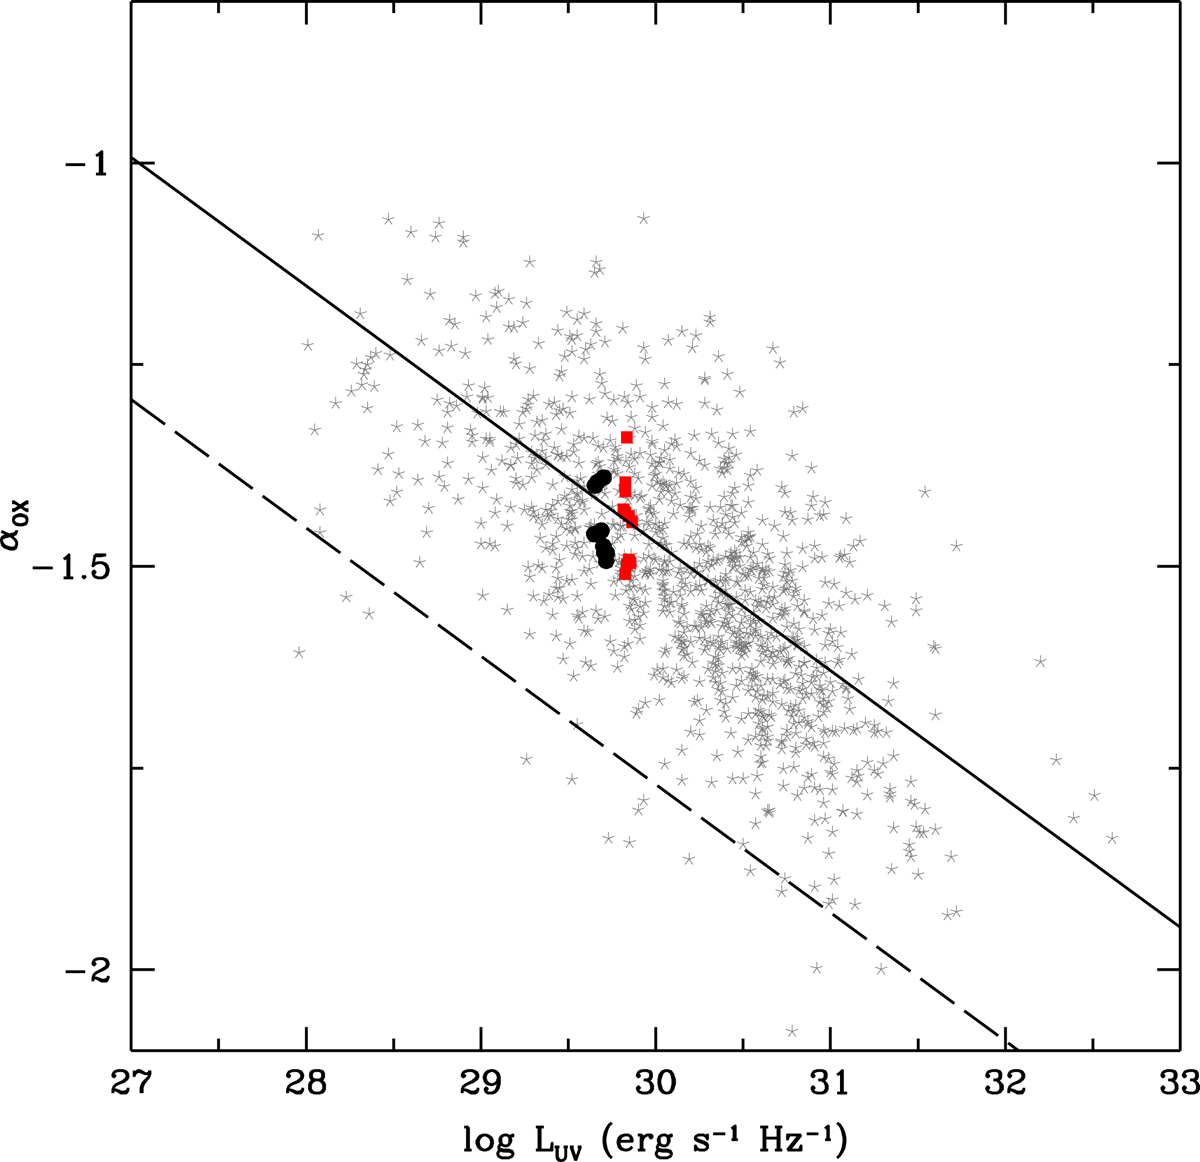
Plot of the αox index vs. the UV luminosity using unabsorbed X-ray luminosities. The gray points are the quasars analyzed in Chiaraluce et al. (2018). The linear best fit is shown as a solid line. The dashed line is the X-ray weak limit defined by Pu et al. (2020). The red squares correspond to the XMM-Newton observations, and the black points correspond to those performed by Swift.
Current usage metrics show cumulative count of Article Views (full-text article views including HTML views, PDF and ePub downloads, according to the available data) and Abstracts Views on Vision4Press platform.
Data correspond to usage on the plateform after 2015. The current usage metrics is available 48-96 hours after online publication and is updated daily on week days.
Initial download of the metrics may take a while.