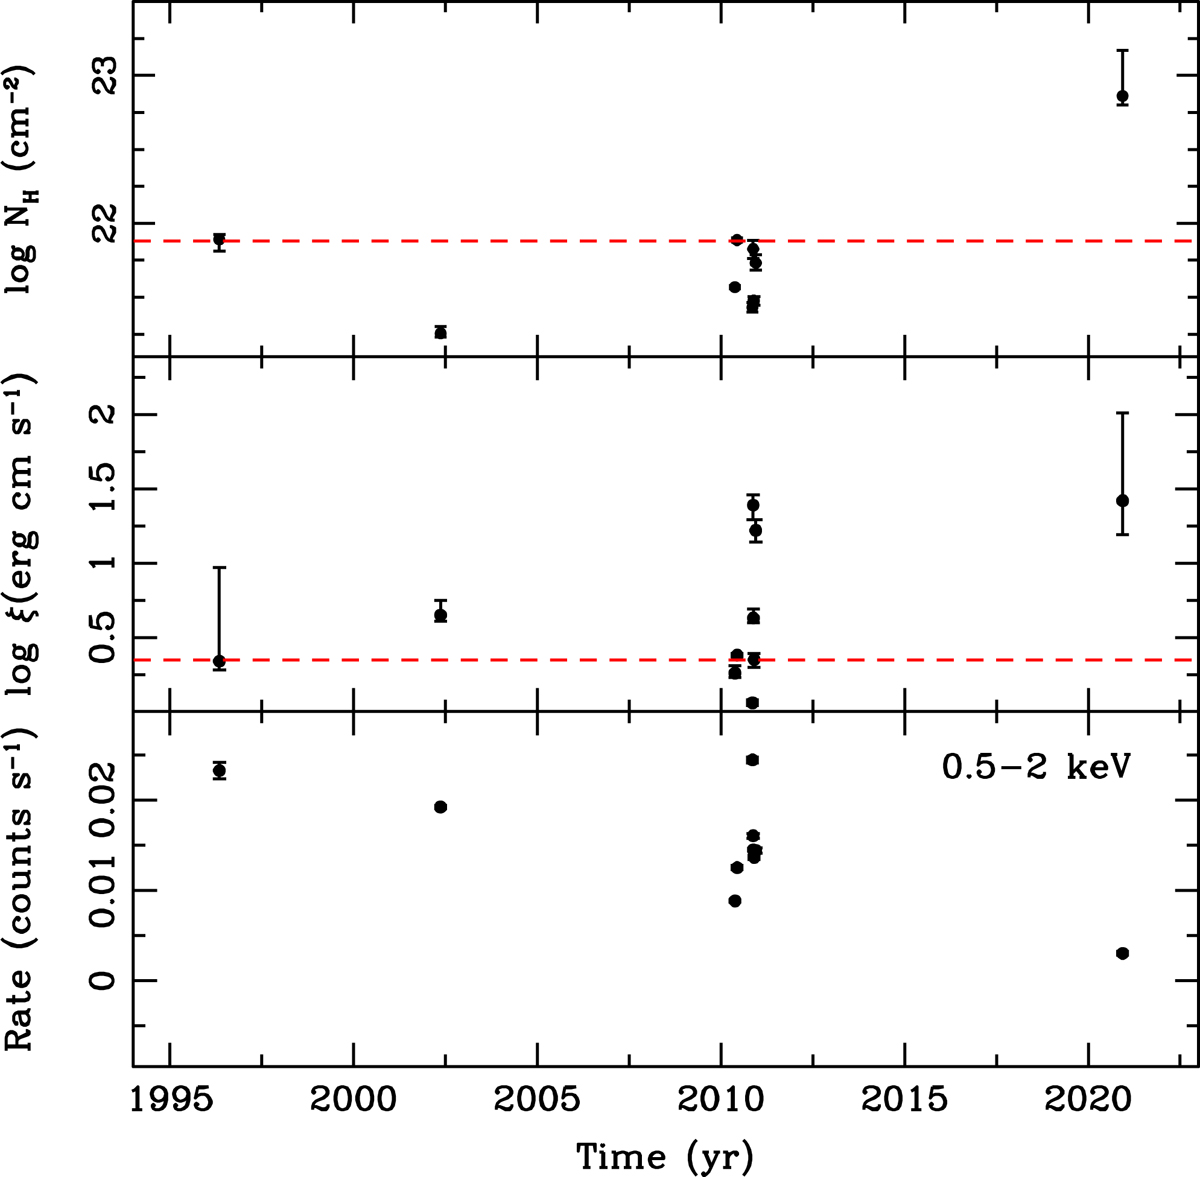
Fig. 7.
Download original image
Time variability of the absorber parameters NH (top) and ξ (middle). For all observations prior to 2019, the black points refer to the variable E-UFO, while the constant WA is represented by the dashed red line. In the lower panel, the light curve of soft X-ray (E = 0.5−2 keV) count rates is shown, where the XMM rates were converted into Swift-XRT count rates using WebPIMMS.
Current usage metrics show cumulative count of Article Views (full-text article views including HTML views, PDF and ePub downloads, according to the available data) and Abstracts Views on Vision4Press platform.
Data correspond to usage on the plateform after 2015. The current usage metrics is available 48-96 hours after online publication and is updated daily on week days.
Initial download of the metrics may take a while.