Fig. 11.

Download original image
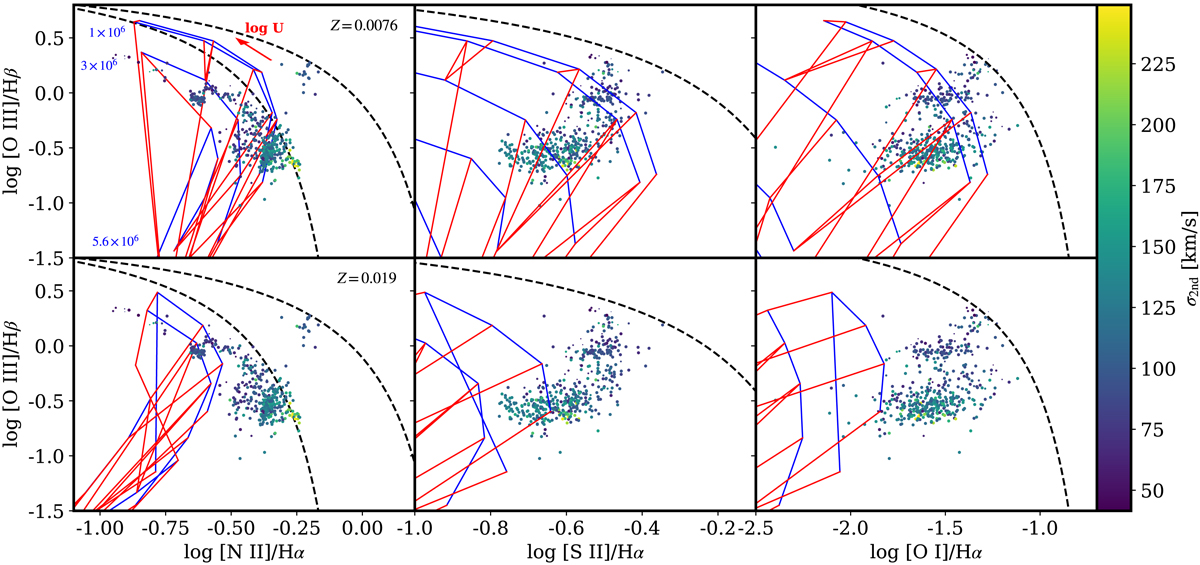
BPT diagrams as shown in Fig. 10, here in comparison with the photoionization grids obtained from the 3MdB database using CLOUDY models. The top and bottom panels show the model results for Z = 0.0076 and Z = 0.019, respectively. For comparison, the sample median metallicity is Z = 0.0086. Blue lines represent different stellar ages of 1, 3, 4, 5.6, and 8.9 × 10⁶ years as ionization sources and are roughly oriented from top right to bottom left as age increases, although not linearly. Red lines represent variation in the photoionization parameter, ranging from log(U) between −4.0 and −2.0 (in steps of 0.5), roughly oriented from top left to bottom right as U decreases. Some stellar age values are displayed in the top-left panel, along with the increasing U orientation.
Current usage metrics show cumulative count of Article Views (full-text article views including HTML views, PDF and ePub downloads, according to the available data) and Abstracts Views on Vision4Press platform.
Data correspond to usage on the plateform after 2015. The current usage metrics is available 48-96 hours after online publication and is updated daily on week days.
Initial download of the metrics may take a while.


