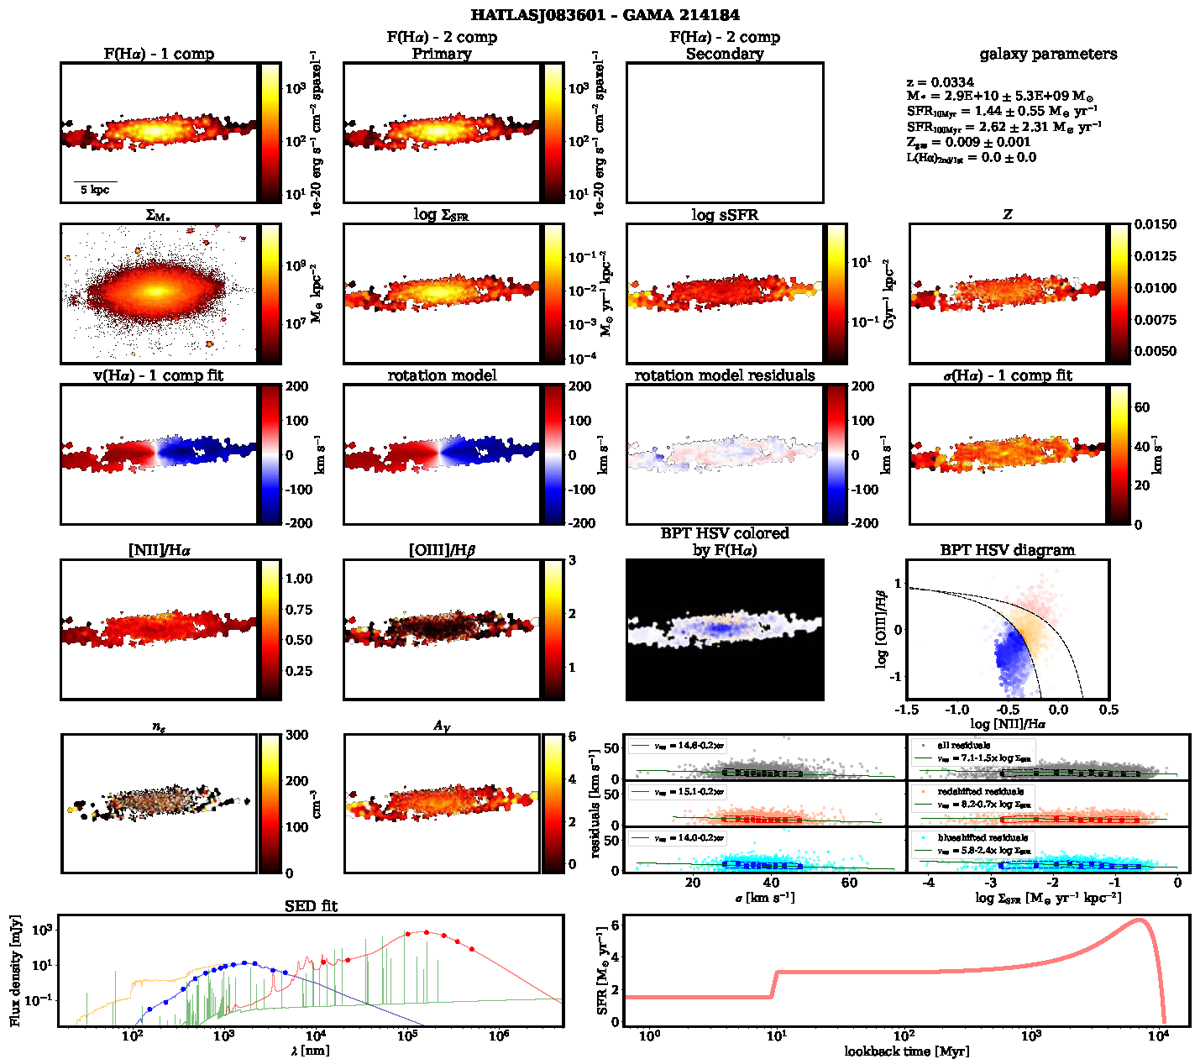
Fig. A.1.
Download original image
Individual data of HATLASJ083601. Listed from top left to bottom right: (first row) Hα emission-line integrated fluxes of the one-component fit and the first and second component of the two-component-fit maps; (second row) maps of the stellar-mass surface density, SFR surface density in logarithmic scale, sSFR surface density in logarithmic scale, and nebular metallicity; (third row) maps of the Hα peak velocity, rotation model, residuals between Hα peak velocity and the rotation model, and velocity dispersion; (fourth row) maps of the [N II]/Hα and [O III]/Hβ ratios, BPT coloring weighted by the Hα flux (using an HSV (hue, saturation, value) color scheme), and BPT diagram; (fifth row) maps of the electron density and optical extinction, and the relations between velocity dispersion and SFR surface density with the rotation model residual velocities; (sixth row) SED fit from CIGALE and SFHs obtained from this fit. A list of physical parameters is also given in the top-right corner of the figure. Aside from the identified Hα flux maps, all maps are retrieved from emission-line measurements. Stellar masses are obtained from the STARLIGHT stellar continuum fit. Nebular metallicity was estimated using the O3N2 calibrator with the relation presented by Marino et al. (2013). The BPT diagram (Baldwin et al. 1981) also displays in dashed lines the commonly used theoretical (Kewley et al. 2001) and empirical (Kauffmann et al. 2003) lines that aim to separate pure star formation and star formation combined with AGN ionization, respectively. Each point in the BPT diagram represents a Voronoi region. Electron densities are obtained by using the PYNEB package (Luridiana et al. 2015) and the [S II]λ6717/6731 ratio, assuming a nebular temperature of 10 000 K. Plots of the dependences of residual velocities with velocity dispersion and SFR surface density are separated into all-Voronoi regions, only regions presenting redshifted residuals, and regions presenting blueshifted residuals, from top to bottom, respectively. Green lines represent a simple fit between the parameters. Finally, the SED fit shows the UV/optical and IR bands fitted in blue and red dots. Blue, orange, green, and red lines represent stellar attenuated emission, stellar unattenuated emission, nebular emission, and dust emission, respectively.
Current usage metrics show cumulative count of Article Views (full-text article views including HTML views, PDF and ePub downloads, according to the available data) and Abstracts Views on Vision4Press platform.
Data correspond to usage on the plateform after 2015. The current usage metrics is available 48-96 hours after online publication and is updated daily on week days.
Initial download of the metrics may take a while.