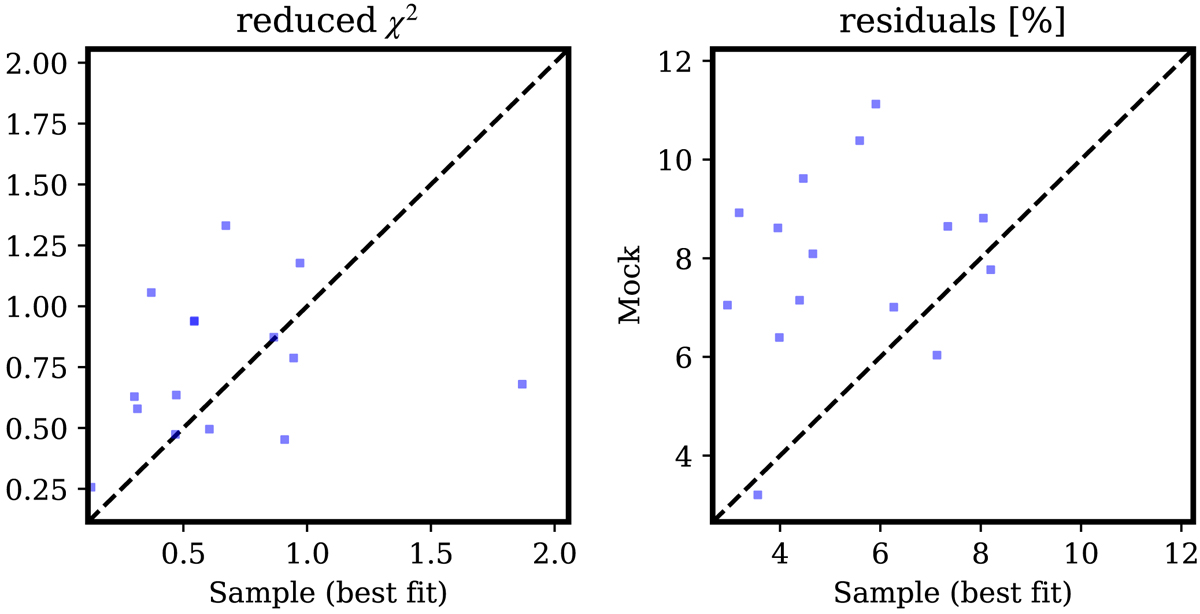
Fig. 2.
Download original image
Quality of the SED modeling of the lower-wavelength photometric broadbands (from FUV to WISE2), with the addition of the Hα and Hβ integrated fluxes from MUSE data. Total reduced chi-square and median residuals (in percentage of the observed magnitudes from GAMA and MUSE), for both the estimated value for the VALES sample and the exact value for the mock sample, are displayed in the left and right panels, respectively.
Current usage metrics show cumulative count of Article Views (full-text article views including HTML views, PDF and ePub downloads, according to the available data) and Abstracts Views on Vision4Press platform.
Data correspond to usage on the plateform after 2015. The current usage metrics is available 48-96 hours after online publication and is updated daily on week days.
Initial download of the metrics may take a while.