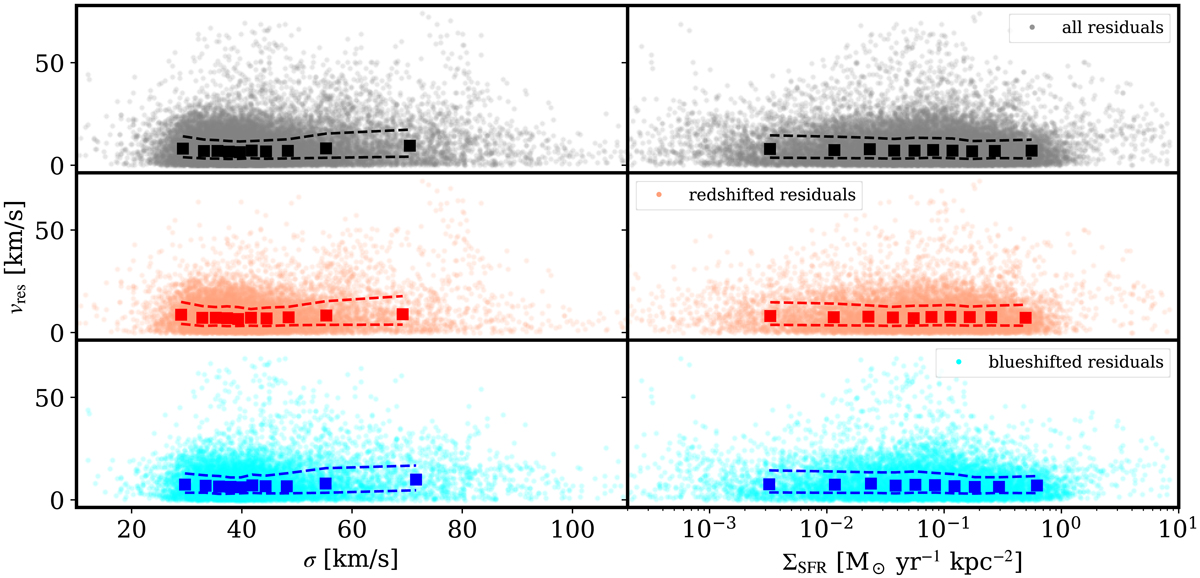
Fig. 4.
Download original image
Relation between the velocity dispersion σ (left) and SFR density ΣSFR (right) with the residual velocities obtained from the rotation model fitted to the Hα velocity fields. Each point represents a Voronoi region. The top panels show the distribution for the whole sample, while the middle and bottom panels are separated into redshifted and blueshifted residuals, respectively. Square symbols represent median values, with the dashed lines representing 25 and 75 percentiles of the distribution. No clear correlation between the two parameters is observed with vres.
Current usage metrics show cumulative count of Article Views (full-text article views including HTML views, PDF and ePub downloads, according to the available data) and Abstracts Views on Vision4Press platform.
Data correspond to usage on the plateform after 2015. The current usage metrics is available 48-96 hours after online publication and is updated daily on week days.
Initial download of the metrics may take a while.