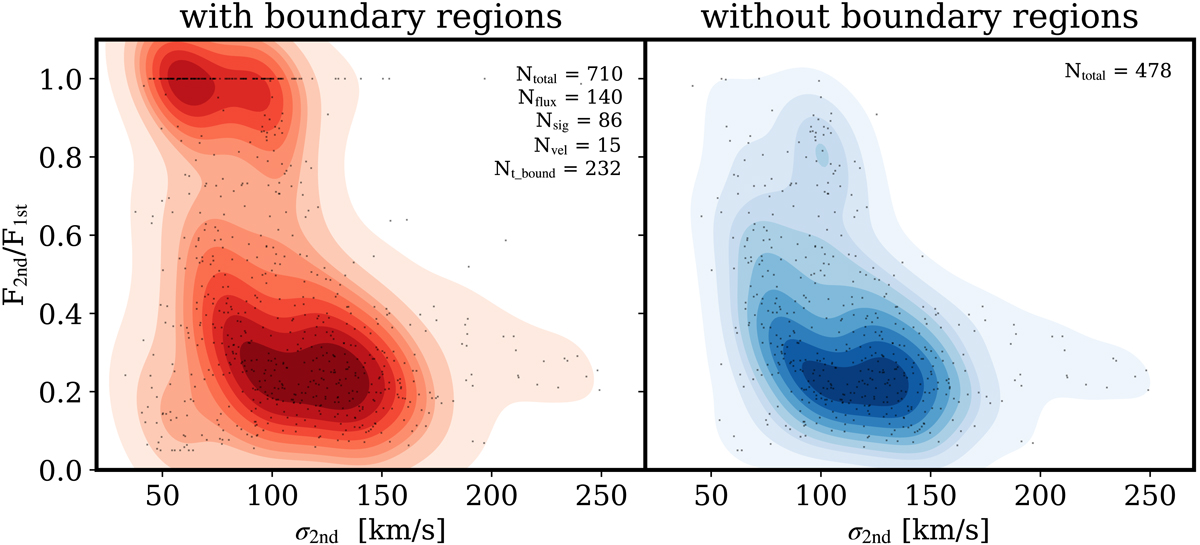
Fig. 5.
Download original image
Relation between the velocity dispersion of the second component and the flux ratio between the second and the first components, from the double-component fit. Left panel: all the Voronoi regions where a double-component fit was performed. These include what we call the “boundary regions” (explained in the text), and the number of such regions, discriminated by criteria, is shown in the top right. Right panel: distribution without boundary regions.
Current usage metrics show cumulative count of Article Views (full-text article views including HTML views, PDF and ePub downloads, according to the available data) and Abstracts Views on Vision4Press platform.
Data correspond to usage on the plateform after 2015. The current usage metrics is available 48-96 hours after online publication and is updated daily on week days.
Initial download of the metrics may take a while.