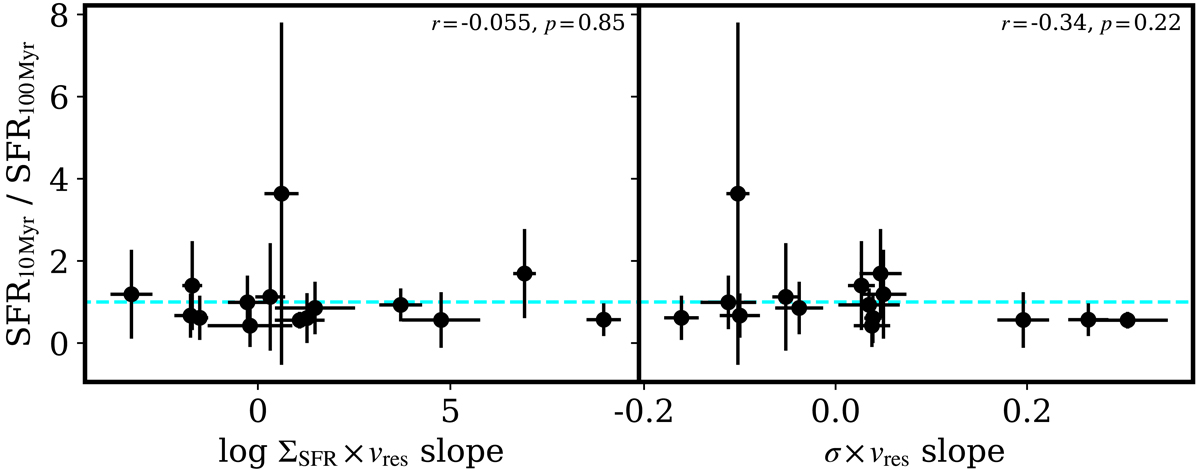
Fig. 8.
Download original image
Relation between the slopes of log ΣSFR (left panel) and the one-component fit σ (right) versus residual velocities and the SFR10 Myr/SFR100 Myr ratio obtained with the SED fit. The slopes are obtained through the fits shown for each individual galaxy in Appendix A. Pearson coefficients are given in the top-right corners; they show no correlation in the first relation and only weak anticorrelation with little significance in the second. The cyan line shows the SFR10 Myr/SFR100 Myr = 1 ratio.
Current usage metrics show cumulative count of Article Views (full-text article views including HTML views, PDF and ePub downloads, according to the available data) and Abstracts Views on Vision4Press platform.
Data correspond to usage on the plateform after 2015. The current usage metrics is available 48-96 hours after online publication and is updated daily on week days.
Initial download of the metrics may take a while.