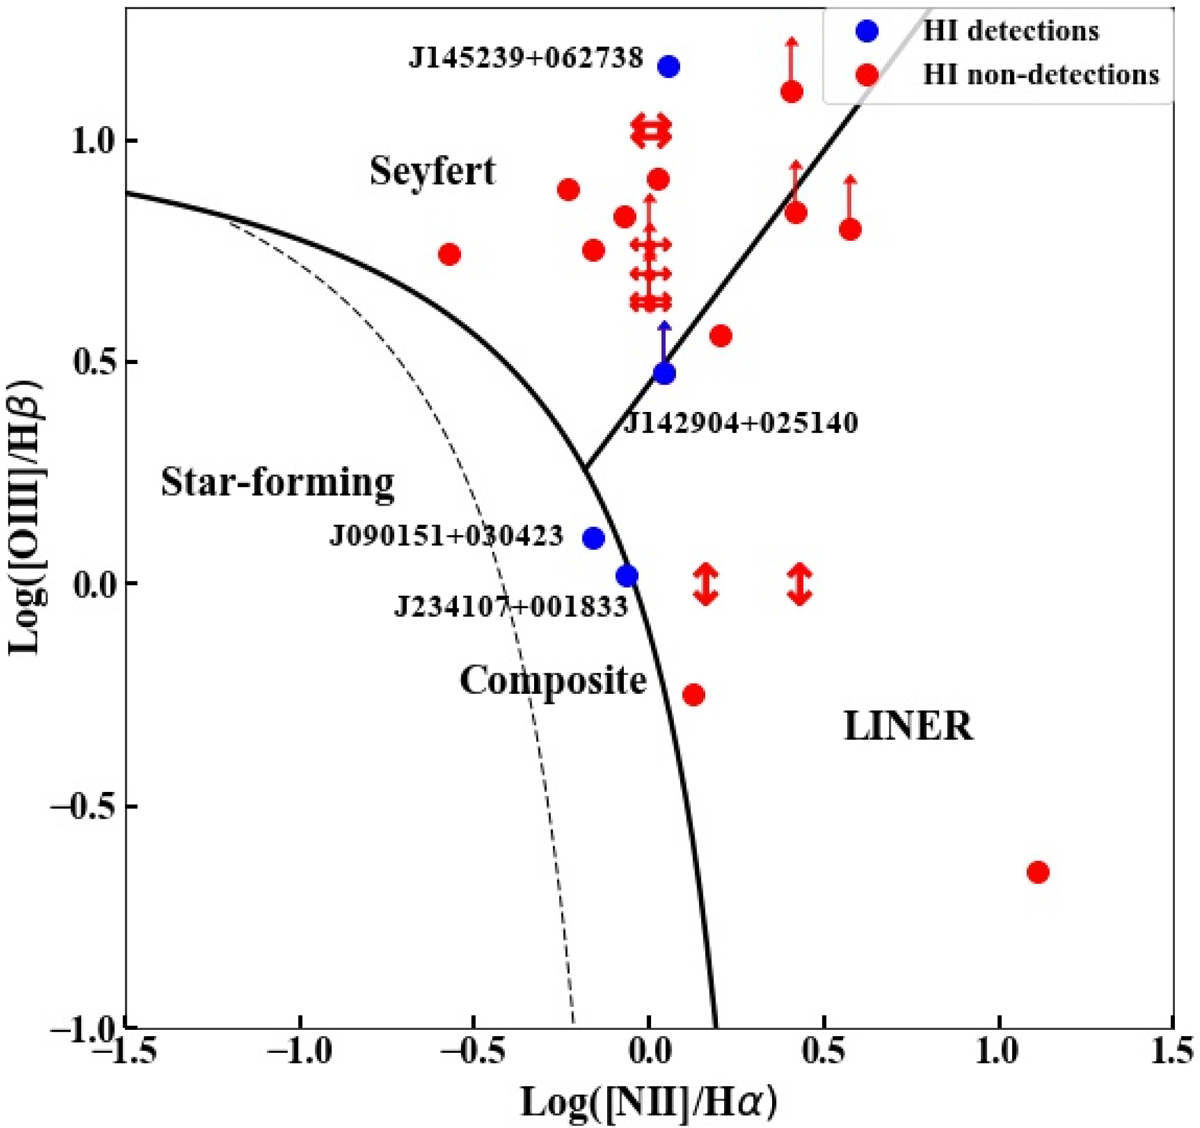
Fig. 3.
Download original image
BPT diagram for the sample. Shown are the H I 21 cm detections (blue dots) and the H I 21 cm non-detections (red dots). One of the detections, J1458+3720, does not have any ionisation lines, and hence could not be included in the diagram. Most of the sources that require double Gaussian components to fit their emission lines are also the more powerful AGN (in the Seyfert region of the diagram).
Current usage metrics show cumulative count of Article Views (full-text article views including HTML views, PDF and ePub downloads, according to the available data) and Abstracts Views on Vision4Press platform.
Data correspond to usage on the plateform after 2015. The current usage metrics is available 48-96 hours after online publication and is updated daily on week days.
Initial download of the metrics may take a while.