Fig. 7.
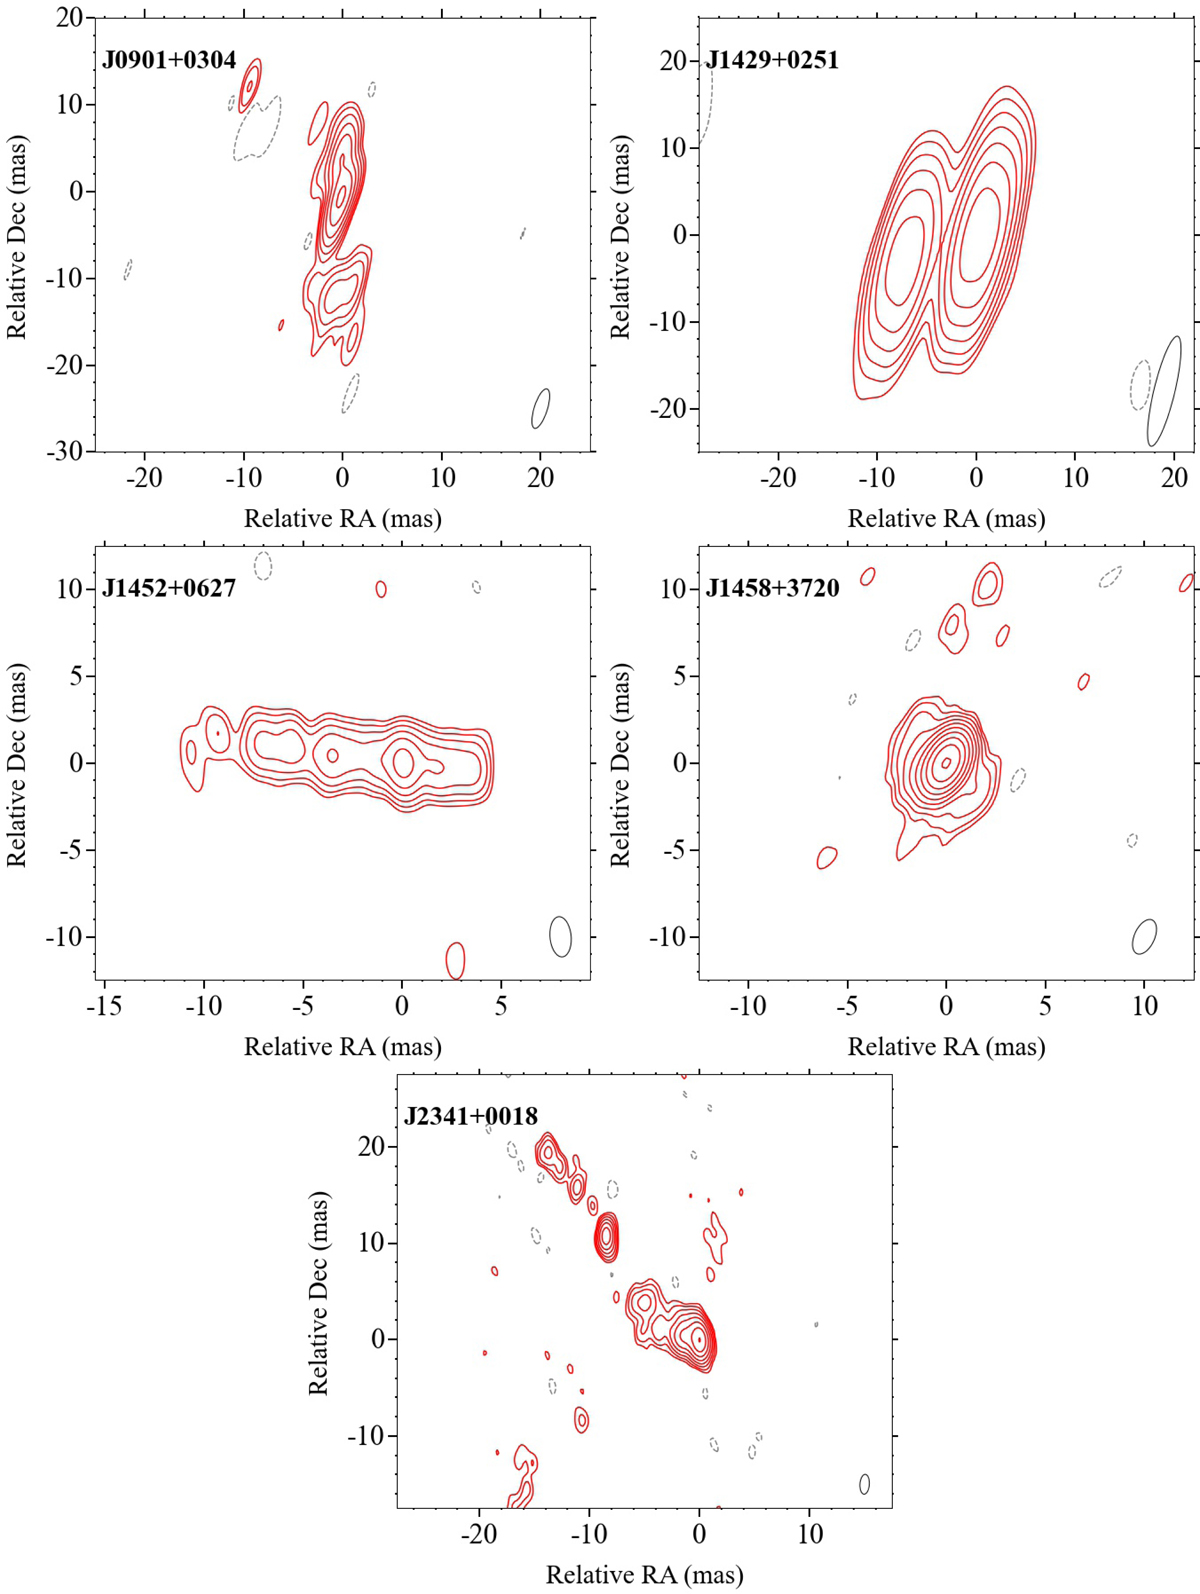
Download original image
VLBI continuum images of the detections at the highest resolution available, taken from the Astrogeo VLBI image database. The contours start at 3σ and increase by steps of 2. The 3σ negative contours are shown in grey. All the images are at X band except that of J1429+0251, which is at C band. These images are from Petrov (2021), Schinzel et al. (2017), Gordon et al. (2016), and Beasley et al. (2002) and are used to model the absorption in Sect. 5.4. The radio core is assumed to be at the centre of the image (corresponding to an offset of 0 mas in RA and in Dec) for all sources except for J0901+0304 for which the assumed centre is to the south of the centre of the image.
Current usage metrics show cumulative count of Article Views (full-text article views including HTML views, PDF and ePub downloads, according to the available data) and Abstracts Views on Vision4Press platform.
Data correspond to usage on the plateform after 2015. The current usage metrics is available 48-96 hours after online publication and is updated daily on week days.
Initial download of the metrics may take a while.