Fig. 1
Download original image
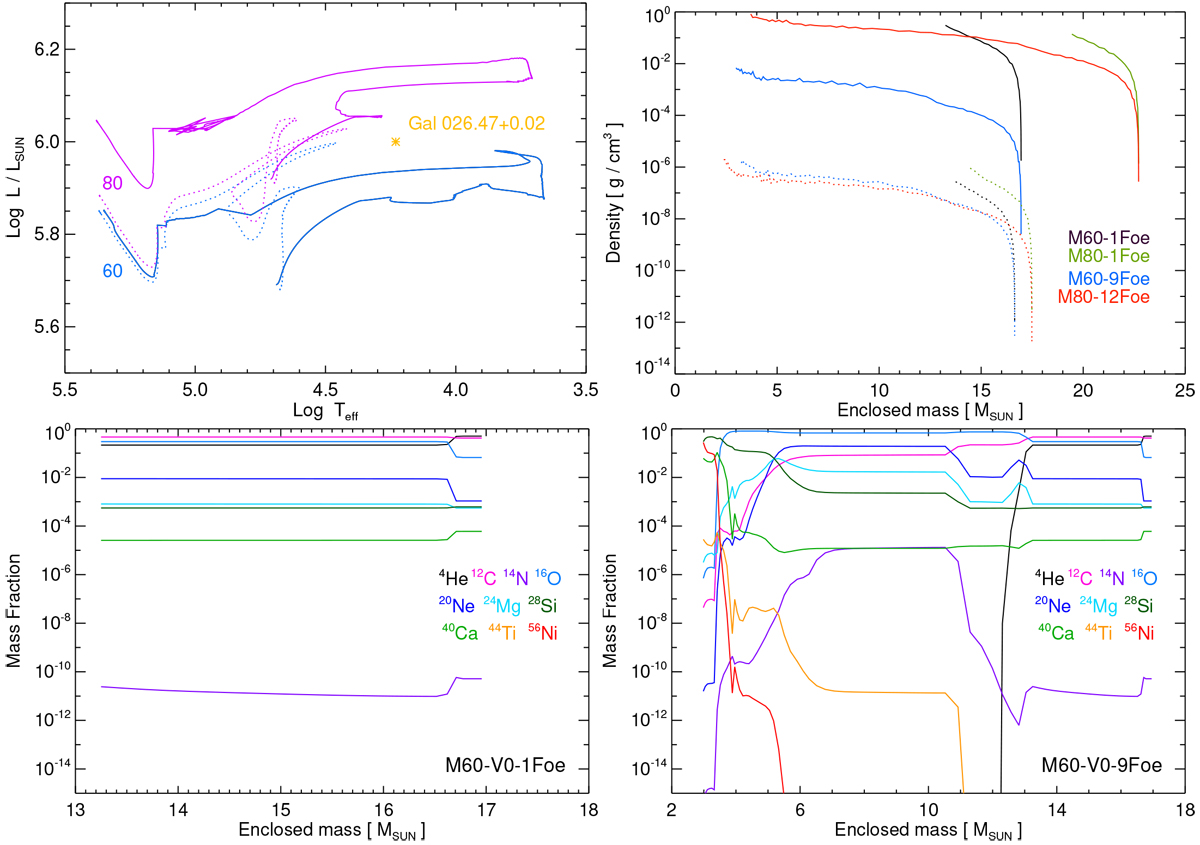
Left upper panel: Pre-SN evolution of stars of 60 M⊙ and 80 M⊙ (from the main sequence phase up to the core He depletion stage, see Limongi & Chieffi 2018), with solar (initial) metallicities and initial rotation velocities Vrot = 0 km s−1 (solid lines) and Vrot = 300 km s−1 (dotted lines). The yellow asterisk marks the position of G26 in the HR diagram. Right upper panel: initial radial profiles of density in the models defined in Table 1. Models with initial rotation velocities Vrot = 0 km s−1 and Vrot= 300 km s−1 are represented with solid and dotted lines respectively. Lower panels: initial radial profiles of mass fractions for the species considered for two representative models, one with a low explosion energy (left panel) and the other with a high explosion energy (right panel). In both cases, the model describes a ZAMS star of 60 M⊙. The range of enclosed mass (x-axis) is very different in these models because of the different location of the mass cut (see Limongi & Chieffi 2018).
Current usage metrics show cumulative count of Article Views (full-text article views including HTML views, PDF and ePub downloads, according to the available data) and Abstracts Views on Vision4Press platform.
Data correspond to usage on the plateform after 2015. The current usage metrics is available 48-96 hours after online publication and is updated daily on week days.
Initial download of the metrics may take a while.