Fig. 12
Download original image
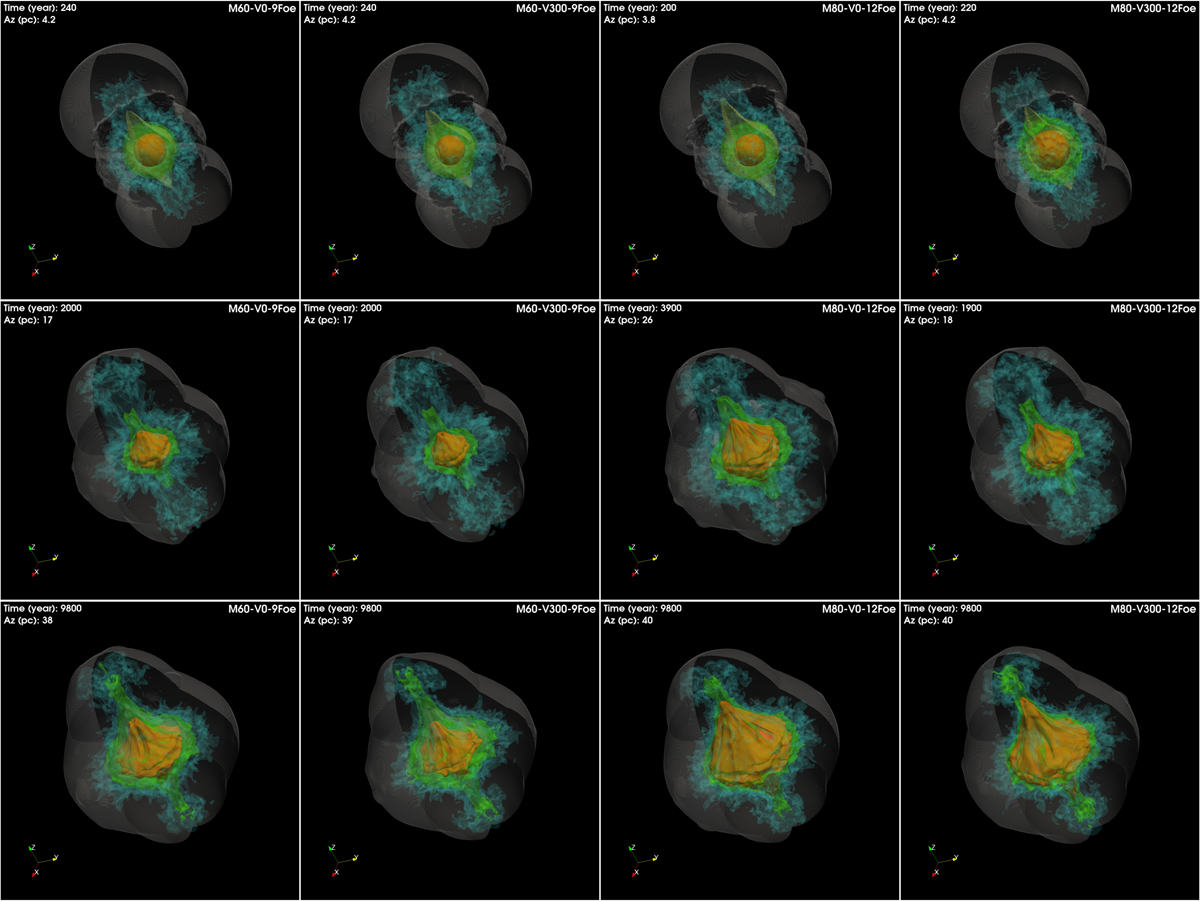
Density distributions for the ejecta rich in Fe (orange), Si (green), and O (blue) for the models with high explosion energy at different evolution times (increasing from top to bottom). The opaque irregular isosurfaces correspond to a value of density at 1% of the peak density in each case. The semi-transparent surface marks the position of the forward shock; the yellow semi-transparent surface barely visible in the top panels represents the position of the reverse shock. The orientation of the system is the same as G26 (see Fig. 2).
Current usage metrics show cumulative count of Article Views (full-text article views including HTML views, PDF and ePub downloads, according to the available data) and Abstracts Views on Vision4Press platform.
Data correspond to usage on the plateform after 2015. The current usage metrics is available 48-96 hours after online publication and is updated daily on week days.
Initial download of the metrics may take a while.