Free Access
Fig. 2
Download original image
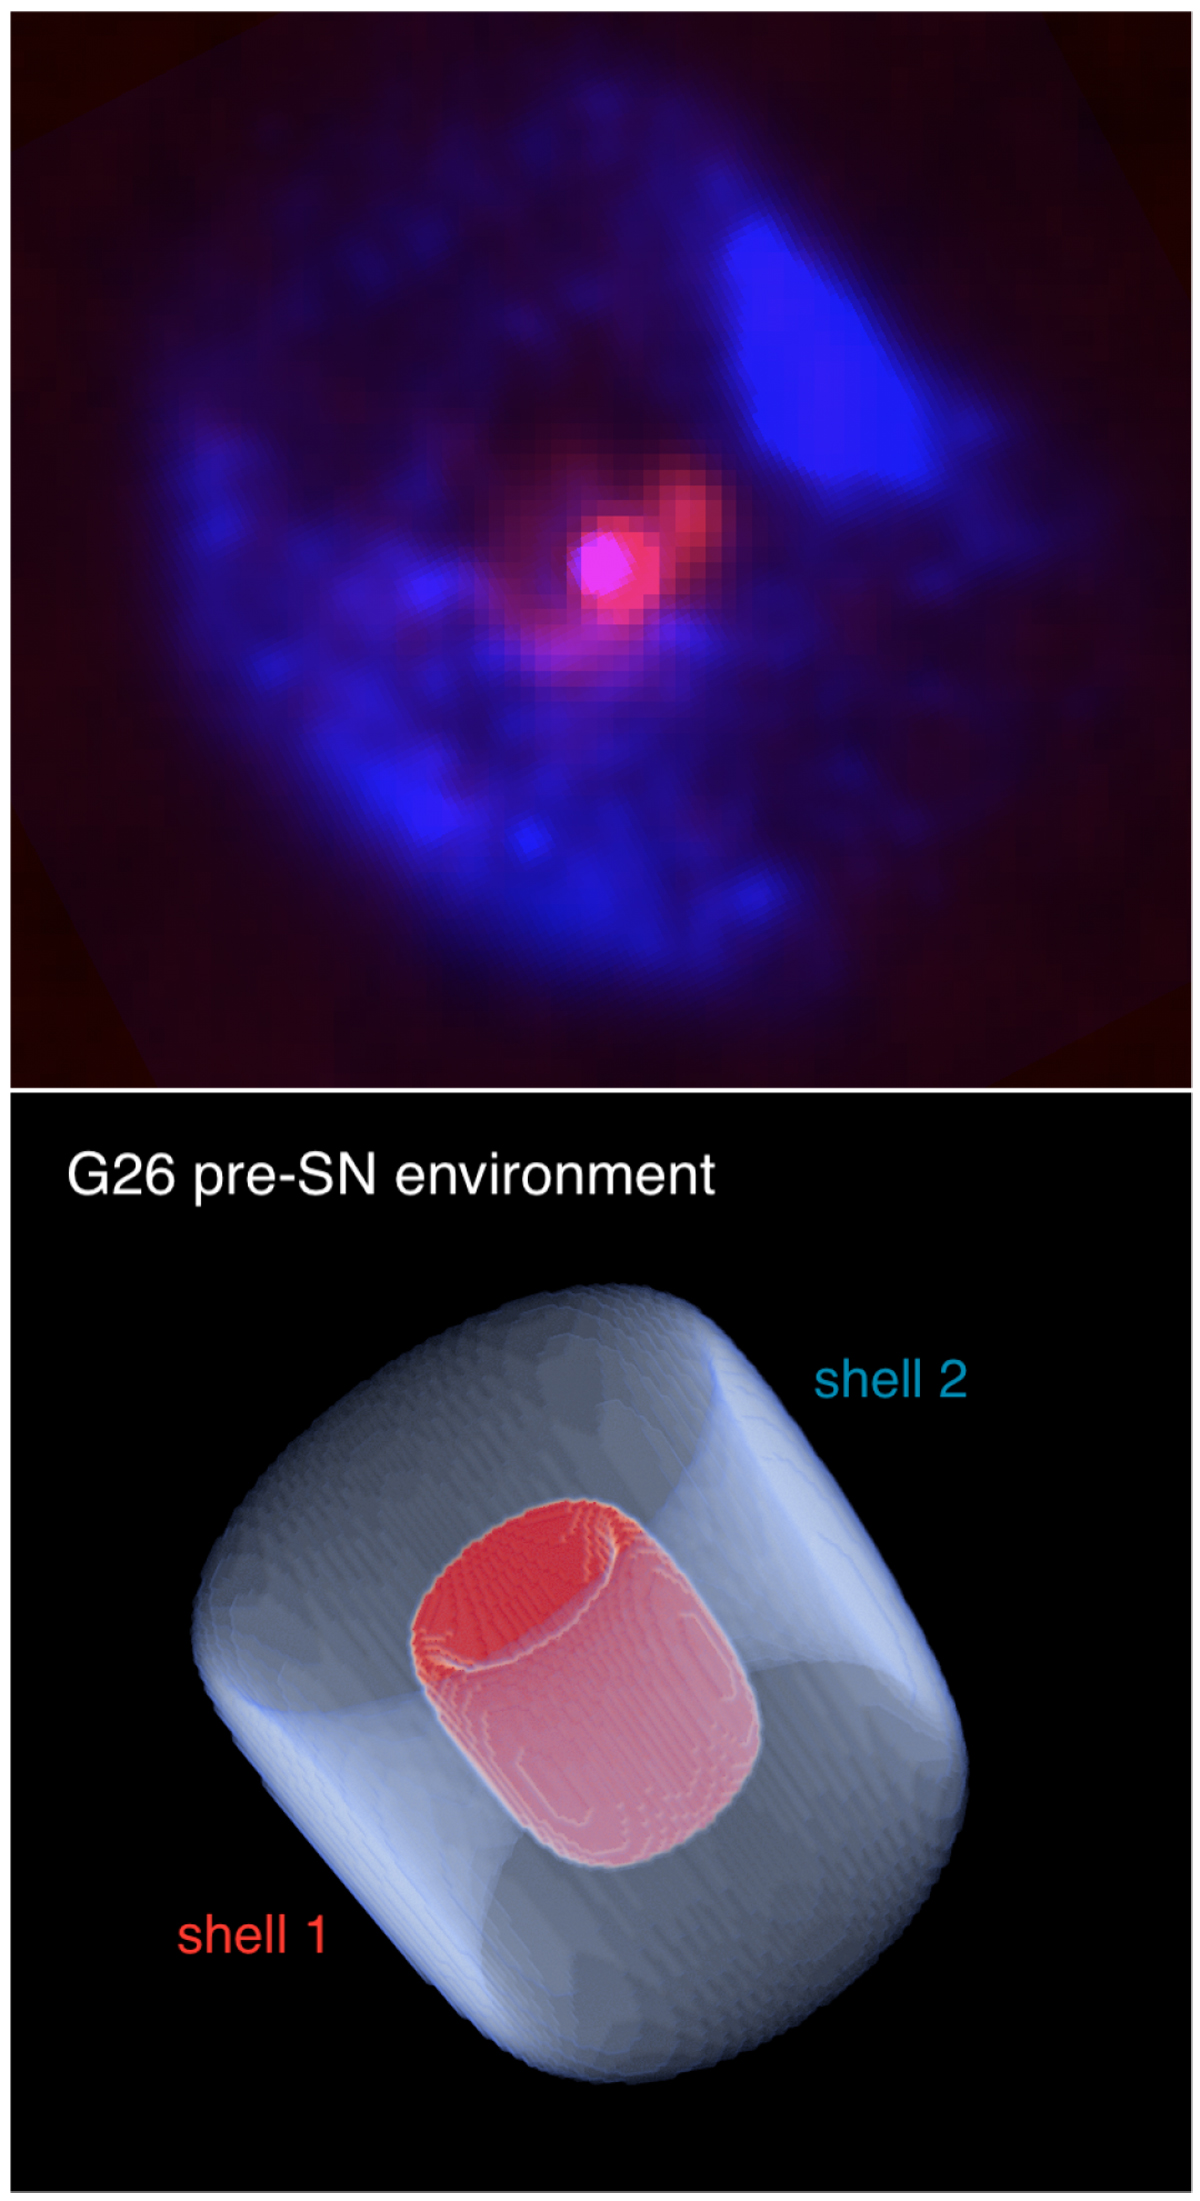
Top: map of G26 which combines infrared at 24 μm (blue) and radio (red) images (see Umana et al. 2012). Bottom: schematic view of the CSM around G26, representing the two dense shells (in red and light blue) observed in the radio and infrared bands. The LBV is located in the center of the two nested toroidal shells.
Current usage metrics show cumulative count of Article Views (full-text article views including HTML views, PDF and ePub downloads, according to the available data) and Abstracts Views on Vision4Press platform.
Data correspond to usage on the plateform after 2015. The current usage metrics is available 48-96 hours after online publication and is updated daily on week days.
Initial download of the metrics may take a while.