Fig. 3
Download original image
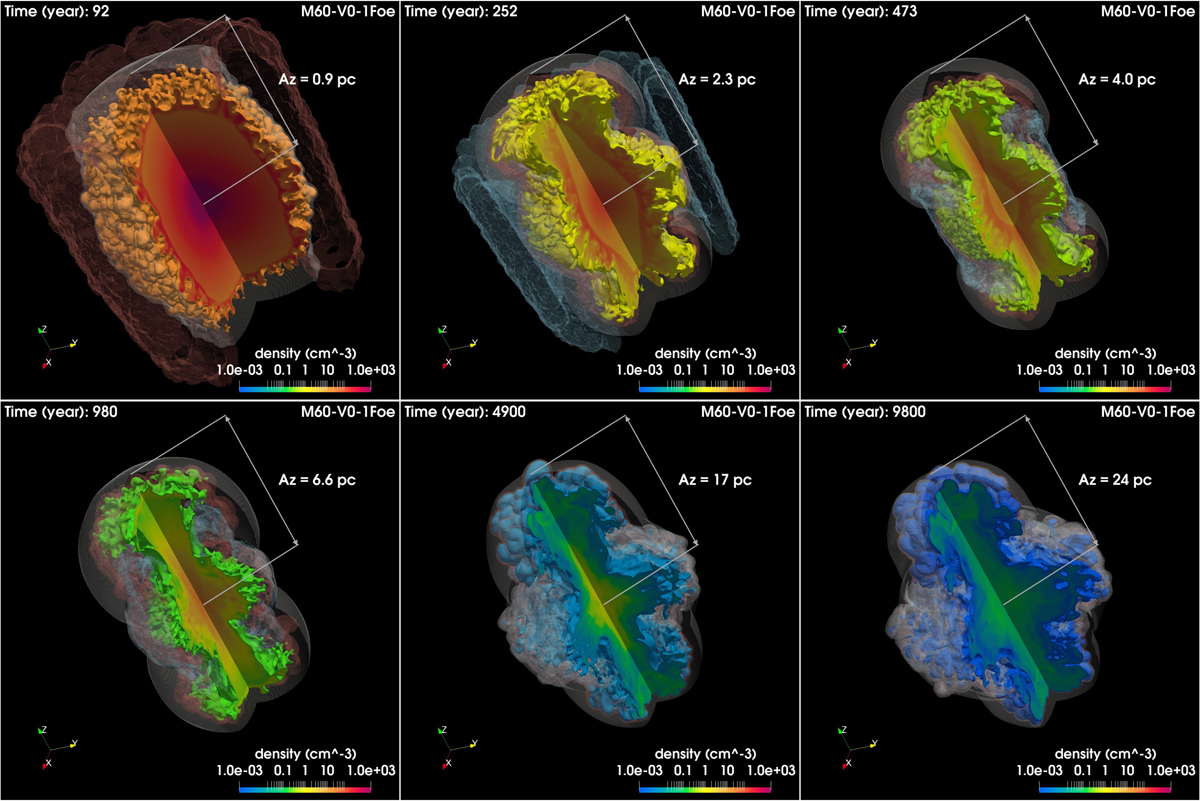
Density distributions of the ejecta of the model M60-V0-1Foe at different evolution times (increasing from upper left to lower right). The opaque irregular isosurfaces correspond to a value of density at 1% of the peak density with one quadrant cut in order to see the radial distribution. The semi-transparent surface marks the position of the forward shock; the initially toroidal semi-transparent structures in red and cyan colors represent the inner and outer shells in the CSM respectively. The system is oriented as G26 (see Fig. 2), corresponding to the rotation angles ix = 30°, iy = 30°, iz = 25° about the x, y, and z axes, respectively. The evolution time is shown in the upper left corner of each panel. Az indicates the distance of the forward shock from the center of the explosion along the z-axis. The complete temporal evolution is available online (Movie 1).
Current usage metrics show cumulative count of Article Views (full-text article views including HTML views, PDF and ePub downloads, according to the available data) and Abstracts Views on Vision4Press platform.
Data correspond to usage on the plateform after 2015. The current usage metrics is available 48-96 hours after online publication and is updated daily on week days.
Initial download of the metrics may take a while.