Free Access
Fig. 12
Download original image
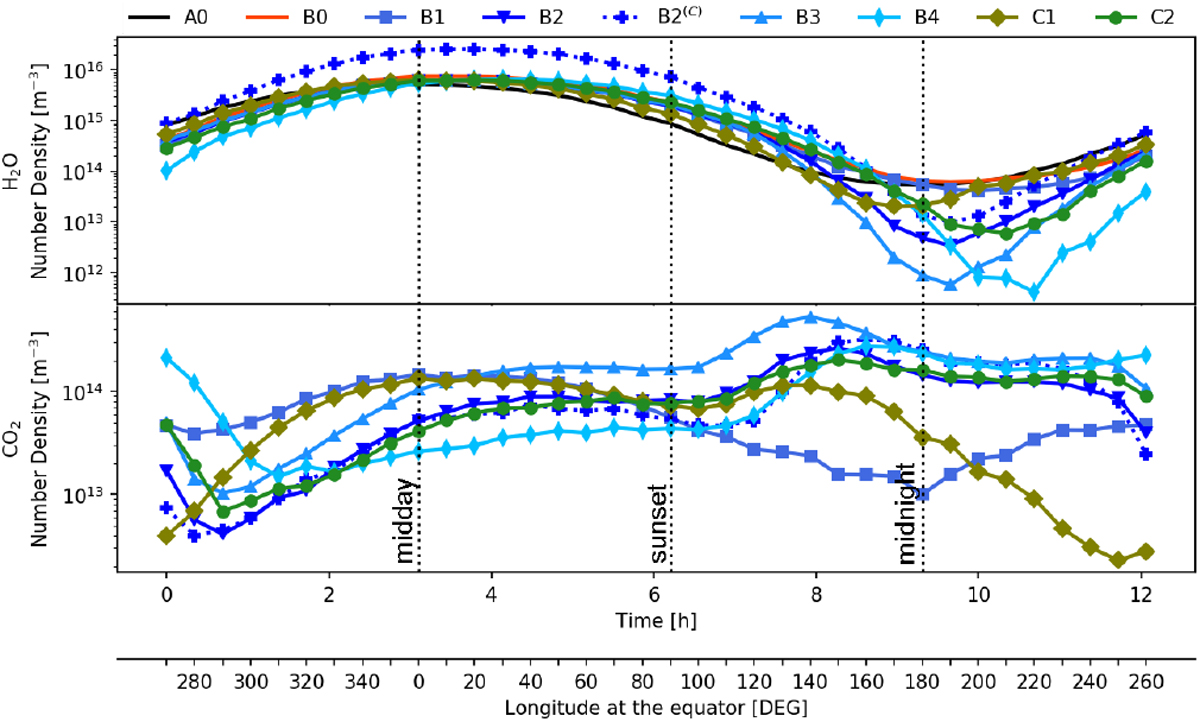
Temporal and longitudinal variation in the H2O and CO2 number densities obtained with DSMC calculations at 8 km from the surface in the equatorial plane. The dotted dark vertical lines indicate the location of the midday, the terminator with the sunset at 90° and midnight.
Current usage metrics show cumulative count of Article Views (full-text article views including HTML views, PDF and ePub downloads, according to the available data) and Abstracts Views on Vision4Press platform.
Data correspond to usage on the plateform after 2015. The current usage metrics is available 48-96 hours after online publication and is updated daily on week days.
Initial download of the metrics may take a while.