Free Access
Fig. 6
Download original image
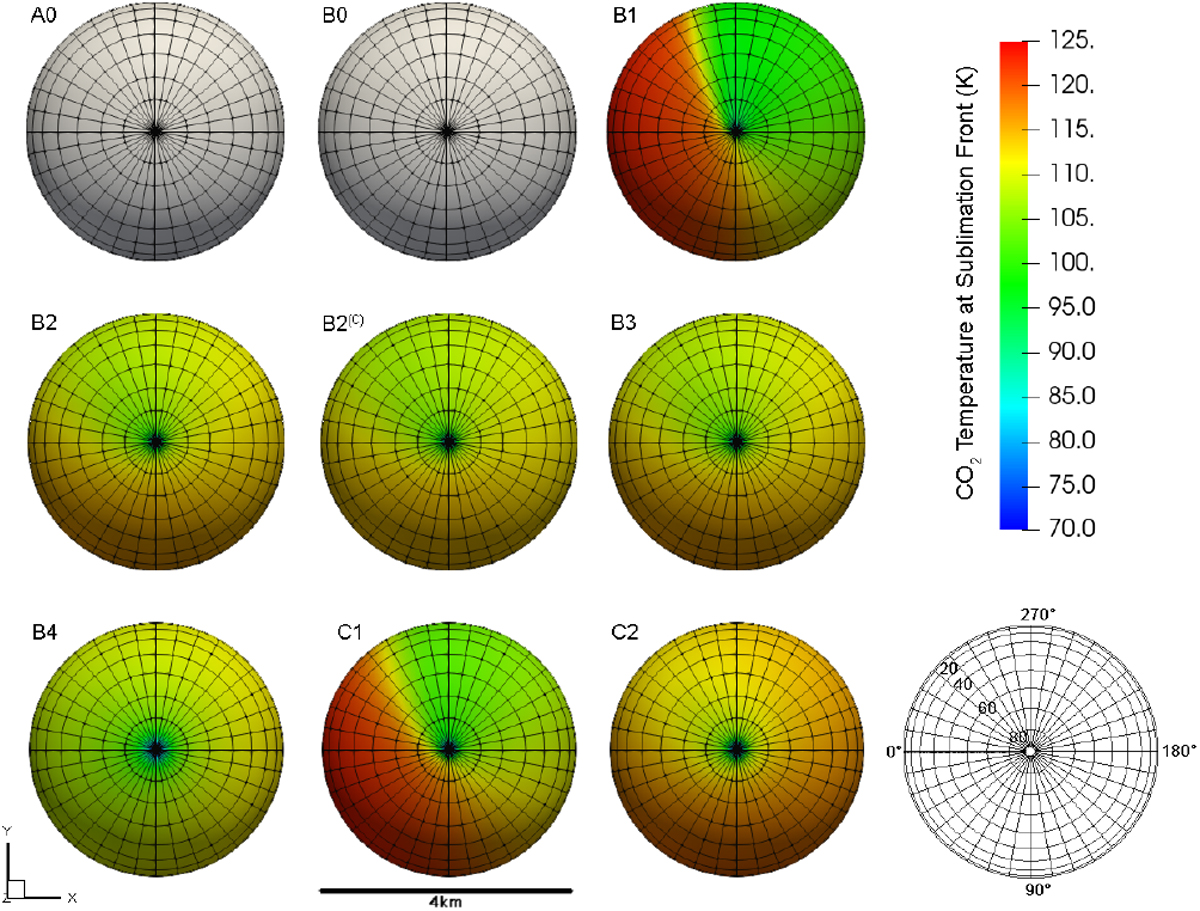
Polar view of the map of the temperature at the sublimation front of CO2 for all cases listed in Table 2. Diagram at the bottom-right of the figure indicates the planetographic coordinates. Cases A0 and B0 have no CO2 emissions, therefore they are shown in white.
Current usage metrics show cumulative count of Article Views (full-text article views including HTML views, PDF and ePub downloads, according to the available data) and Abstracts Views on Vision4Press platform.
Data correspond to usage on the plateform after 2015. The current usage metrics is available 48-96 hours after online publication and is updated daily on week days.
Initial download of the metrics may take a while.